Swarm vs. Iridium For Satellite IoT
Using Satellite for IoT
If you are involved in building Internet of Things solutions for industry, you are probably familiar with radio technologies that connect IoT sensors to the Internet: WiFi, cellular, LoRa, etc. What about satellite connectivity? Wifi or cellular connectivity may not be available where you need to deploy a solution. Perhaps you are monitoring sensors on an ocean vessel or a remote oil well. With many aspiring entrants in the satellite IoT space (no pun intended), it’s time to get serious about comparing not only the costs, but how these systems actually perform.
Using satellite connectivity is becoming a more viable option as new solutions like Swarm come to market. This article compares Swarm’s offering to the well-established Iridium Short Burst Data (SBD) service. This isn’t just a comparison of the features and costs — I’ve run experiments with Swarm and Iridium modems to compare the latency and performance of each system so that you can make decisions based on actual data. By just looking at the sizes of the satellites, we can see that this is a David vs. Goliath story!
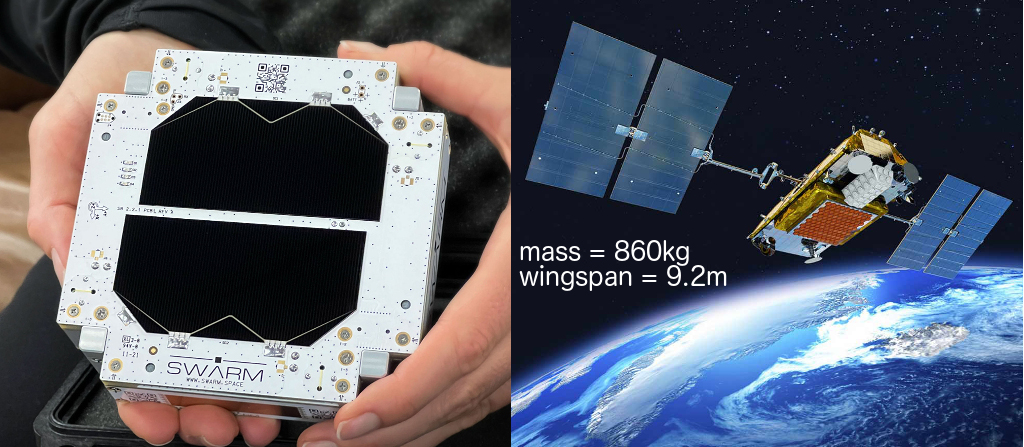
Swarm and Iridium satellites
I know you are probably wondering about costs, right? The Costs section below gives the cost details, but the quick summary is that Swarm is cheaper than Iridium both in terms of CapEx and OpEx. That’s capital expenditures and operation expenses for you non-CFOs. But cost is not the only concern, so you might find the cost differences immaterial given the actual operational characteristics that you need. So let’s get into how these two satellite IoT solutions actually work and how I measured their capabilities.
Swarm
Swarm Technologies (acquired by SpaceX in 2021) has launched (as of this writing) approximately 175 small “SpaceBEE” satellites about the size of a piece of bread. They are about 2.8cm thick, so more like Texas toast. According to CelesTrak, they are near polar orbits (I think they are sun-synchronous orbits) providing coverage at all latitudes and are in several orbital planes at a variety of LEO altitudes. Here’s a snapshot of the orbits using a tool that I made to help me see where things are. Swarm also provides a pass checker tool which probably takes into account which satellites are actually operational.
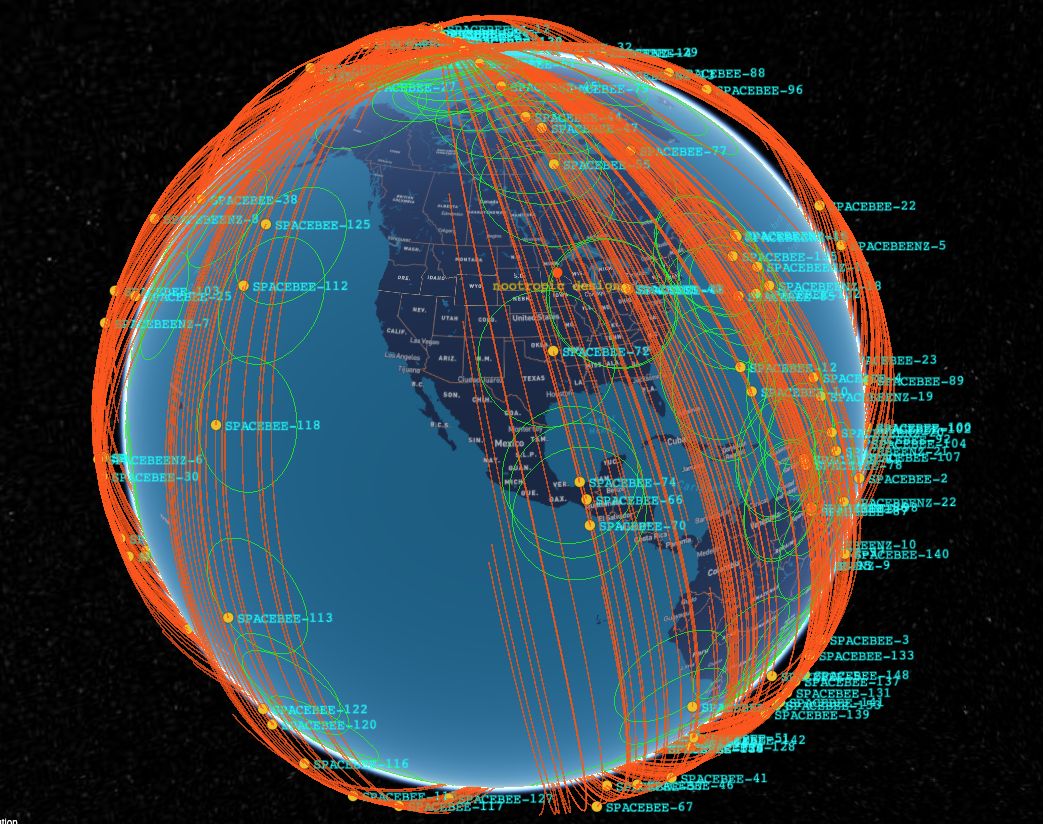
Swarm constellation — note separation between orbital planes
To communicate with the Swarm satellite network, I bought the Swarm evaluation kit in fall of 2021. It came with a tripod, solar panel, antenna, and circuit board with the Swarm modem and all required power management circuitry. It came with a FeatherS2 development board with pre-loaded firmware for communicating with the modem. The FeatherS2 has an Adafruit OLED display. This is a very nice kit that has everything you need to start communicating right away.
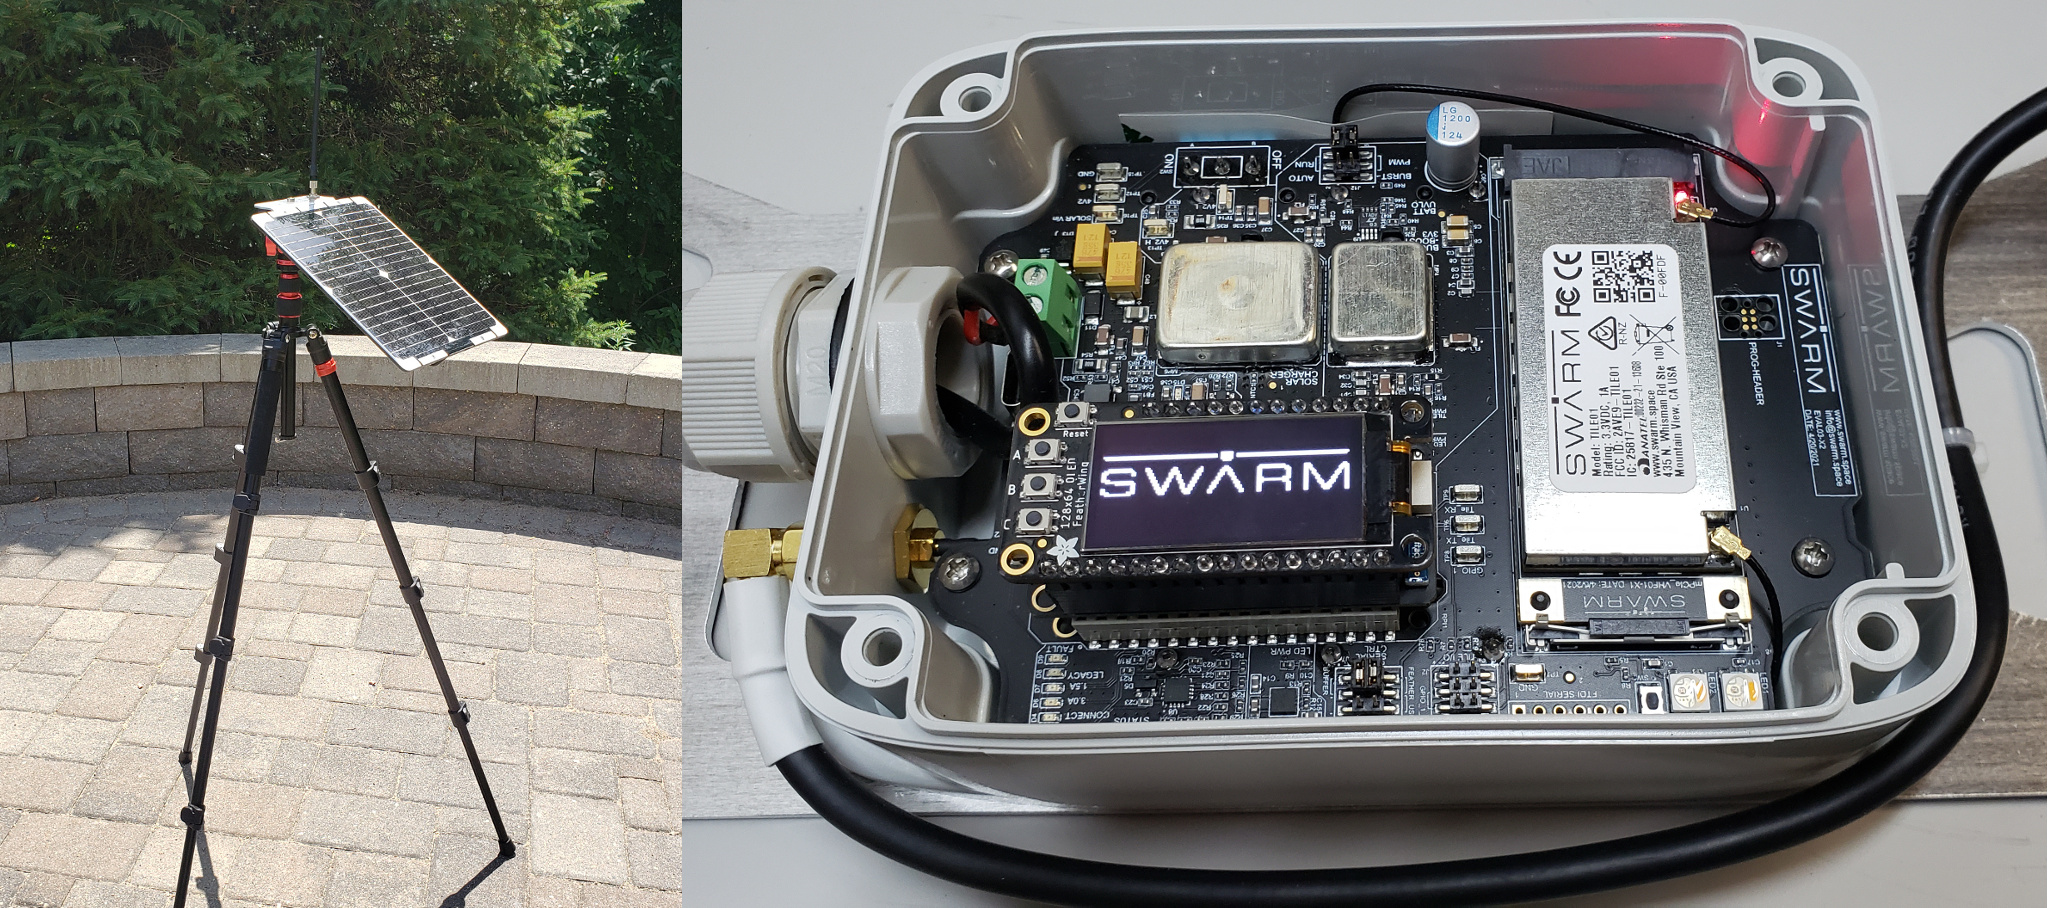
Swarm evaluation kit
Note that this version of the eval kit has their first generation “Tile” modem, which has been superseded by their new M138 modem. I don’t know if the performance of the new modem is better, but as we will see, the ability to send messages has much more to do with satellite coverage than the modem hardware. It’s obvious in the orbit image above that there are significant gaps in coverage between orbital planes, and this has a huge effect on the time it takes to successfully deliver a message.
The goal of the experiments is to measure how long it takes to deliver messages from the modem to the Internet. Sending messages using the Swarm modem is easy. As a developer, you just send NMEA-like sentences over a serial connection to the modem. Messages are queued in the modem until the modem can successfully uplink it to a passing Swarm satellite. The modem can hold up to 1000 messages that it will continually try to uplink, so as a developer, it’s like a fire-and-forget approach. Nice.
Whichever Swarm satellite received the message will downlink the message to a ground station. Messages that have been delivered to Earth show up on the online site Swarm Hive. Hive can also deliver the message to your own infrastructure using a webhook (I had my messages delivered to a Node-RED endpoint). This article is not going to get into all the code details of how I performed the experiments, but the source code is linked in the Resources section below.
In order to assess the characteristics of the network, there are two things we want to measure: the time it takes for a message to be received by a satellite and the time it takes to be downlinked to a ground station and made available in the Hive.
time to uplink + time to downlink and deliver = total time
Measuring these is a bit tricky. After handing a message to the modem using the $TD command, the modem responds with a unique identifier for that message. Eventually when the message is uplinked, the modem provides an unsolicited message $TD SENT with the unique identifier. My firmware keeps track of how long this process took and saves all of the information in a .csv file on the FeatherS2 filesystem. On the receiving side, I deployed a Node-RED endpoint to serve as a webhook to which the Hive could deliver my messages. The problem is that the delivered message does not contain the unique identifier known to the modem, so there is no way to correlate what the modem knows with what the Hive knows. To solve this, I included my own unique identifier in the payload of the message. This way I could match up the uplink measurements performed on the FeatherS2 code with the received messages in my Node-RED code.
I ran my experiement to send a message every 15 minutes for 8 hours. For each message I was able to determine how long it took for the modem to uplink it to a satellite, and then how long it took for that satellite to deliver the message to my Internet endpoint. The detailed results are in the Experimental Results section below. In summary, Swarm messages can take up to several hours to be uplinked if your ground station is under a gap in the orbital planes. Sometimes there were a dozen messages queued up in the modem. But eventually, when there are satellites overhead, the messages will get uplinked, sometimes 5 at a time. Once uplinked, the downlink/delivery time is usually pretty short.
It’s worth noting that messages will not necessarily be uplinked in the order they were sent, so “queue” is not the right word for what the modem is doing. I also observed several cases where the modem reported the uplink of a message after the message had already been delivered to Earth. Sometimes this happened several hours after terrestrial delivery. I don’t know if that’s a bug or if it’s just a design characteristic of the way the network acknowledges receipt of a message to the modem. I have omitted those few anomalies from the statistics below.
Bottom line? Swarm makes it easy to send messages from an embedded microcontroller IoT solution. The messages may get uplinked and delivered right away if you are lucky, or you may wait several hours. But they do get delivered! In all of my experimentation I have never lost a message.
Iridium
Iridium is the decades-old 800 pound gorilla in the commercial space communications industry. Literally, their Iridium NEXT satellites weigh significantly more than 800 pounds each (a lot more). This doesn’t mean that their satellites are old and obsolete. The current generation is quite new, and don’t forget that these satellites are used for satellite telephone conversations. Iridium satellites communicate with one another using microwave links with nearby satellites in order to create a real-time communication link capable of maintaining a telephone conversation. That’s nothing short of incredible, in my opinion. IoT messages should be a piece of cake, and from what I can tell, it is. The Iridium constellation is 66 satellites in polar orbits at the somewhat high altitude of 781 km giving them global coverage.
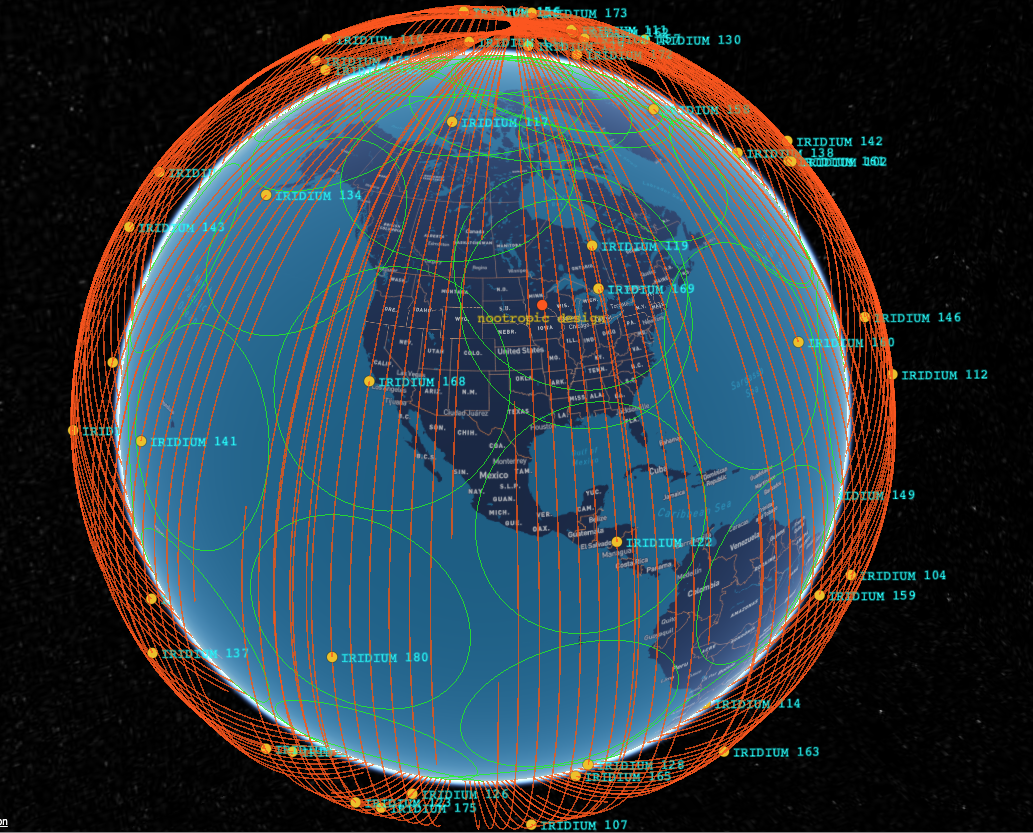
Iridium constellation provides full coverage
For IoT using small messages, Iridium offers the Small Data Burst (SBD) service. I’m using the Ground Control (formerly Rock Seven Communications) RockBLOCK 9603 modem. You can also buy it from SparkFun.
For my experiments I used a simple development board that I had built for a project called Iridium satellite communication. It incorporates the modem with a GPS receiver because the Iridium modem does not have integrated GPS like the Swarm modem. GPS is important for knowing what time it is, not where we are.
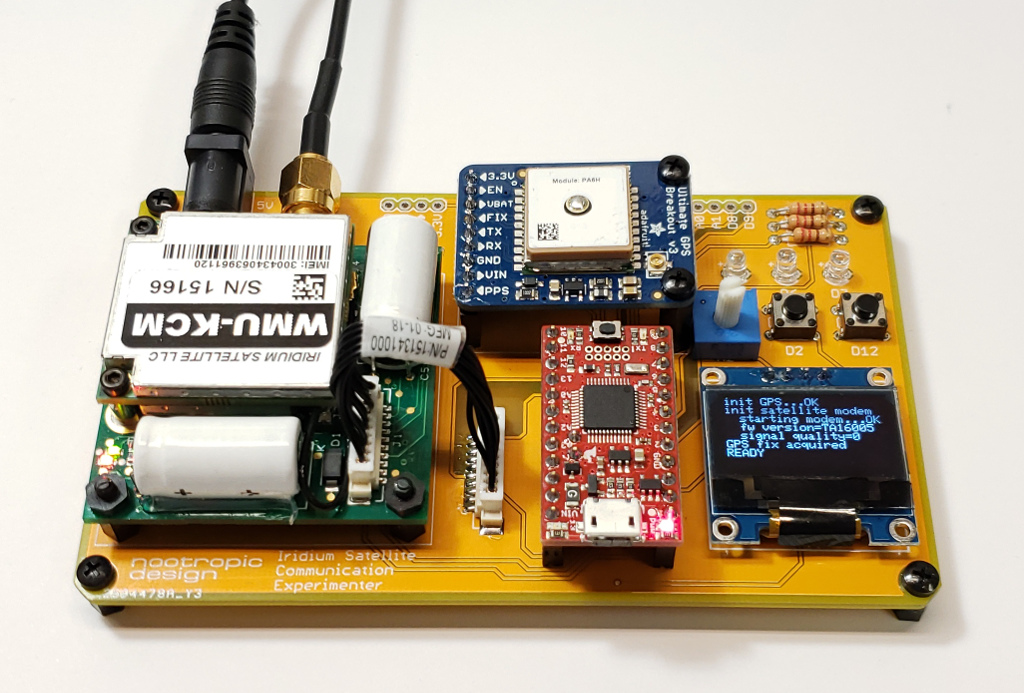
Simple Iridium development board
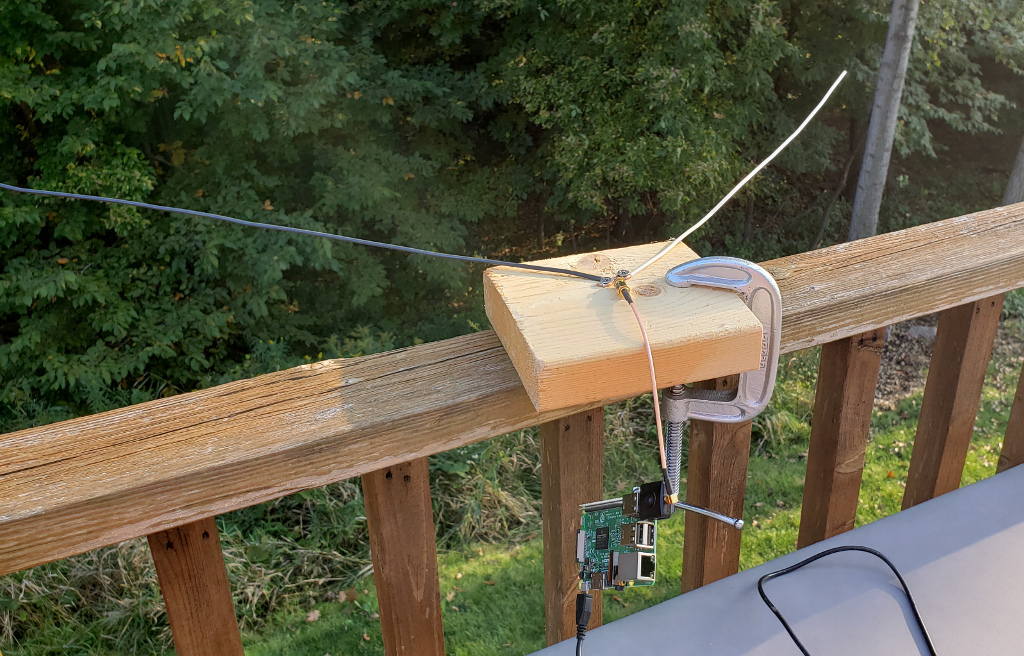
Here is my ground station. The dev board is in a plastic box in case it rains. I’m using an external antenna (also available from SparkFun), and power is provided by a large battery with solar charger.
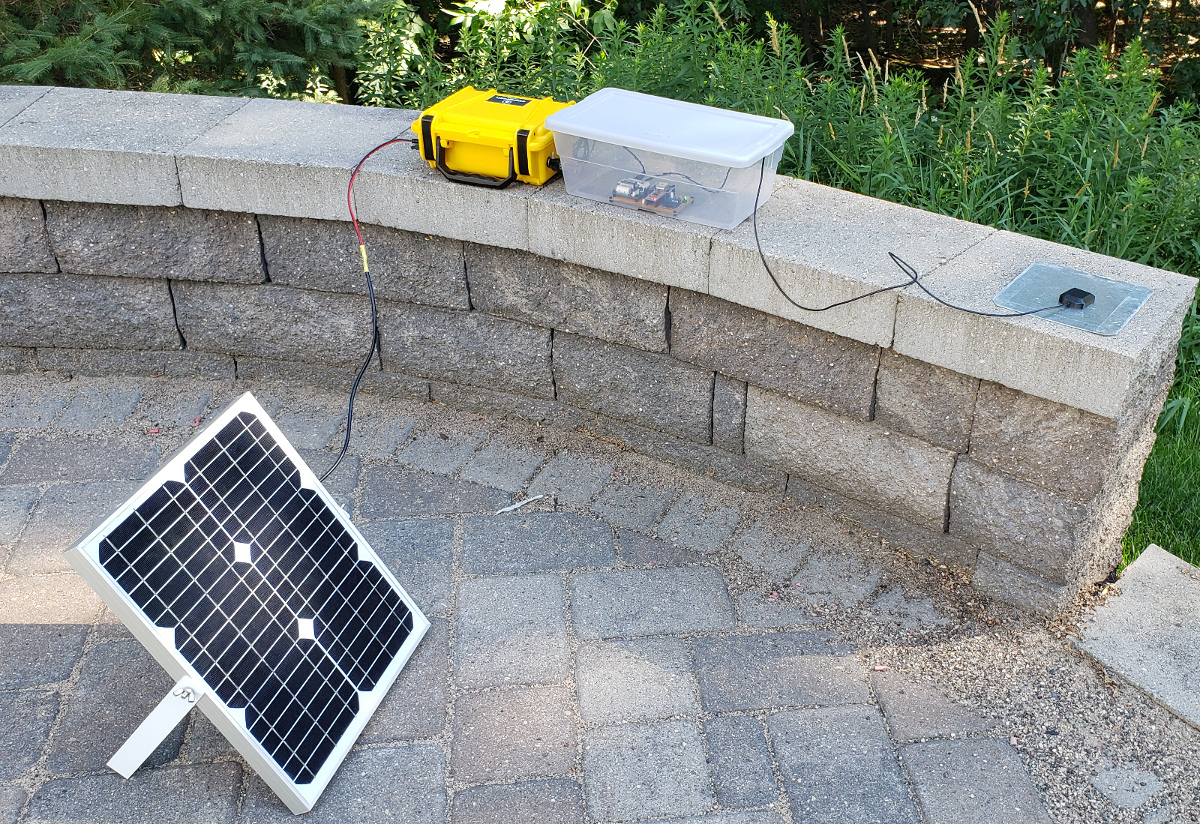
Iridium ground station
Just as I did with Swarm, I ran the experiement for 8 hours, sending a message every 15 minutes. Using the Iridium modem is quite different than Swarm, though. The Iridium modem can only handle one message at a time, so there’s no fire-and-forget model. The embedded software on the microcontroller needs to interact with the modem to wait for the successful uplink and cannot send any other messages until the uplink succeeds, times out, or is canceled. From a development perspective, it’s much more hands-on, but luckily there is an excellent Arduino library, Mikal Hart’s Iridium SBD library, that makes this as painless as possible.
After successful uplink, the message will be downlinked to an Iridium ground station somewhere — possibly being passed between other Iridium satellites! — and delivered to the Ground Control online management console similar to Swarm’s Hive site. Ground Control will also deliver the message to a webhook, so I am also having the data sent to a Node-RED endpoint for analysis.
Measurement of the uplink time and downlink time is easier with Iridium than with Swarm. The data delivered to the management console and my webhook tells me when the message was received by an Iridium satellite. I know when I sent the message because I include a timestamp in the payload itself. So at the Internet endpoint, I know when I attempted to send the message, when it was actually received by a satellite, and when it was delivered to Earth. Full results are below, but the bottom line is that Iridium’s global coverage and microwave interconnects provides fast and predictable delivery of IoT messages. Sometimes it takes 10 minutes, but usually only a few minutes, and sometimes almost instantly.
Experimental Results
Ok, it’s finally time to review the results. Below are tables showing the minimum, maximum and average measured times for the uplink, downlink, and total latency. You can see clearly that Swarm messages can take hours to deliver (one took almost 2 hours). If Swarm satellites are overhead, though, it can only take a couple of minutes. On average, over an 8 hour experiment sending a message every 15 minutes, Swarm delivered the messages in 39 minutes, 44 seconds.
| min | max | average | |
| time to uplink | 00:00:30 | 01:56:45 | 00:32:47 |
| time to downlink | 00:00:07 | 00:35:22 | 00:07:31 |
| total time | 00:02:32 | 01:58:37 | 00:39:44 |
Iridium, on the other hand, is much faster. It can take up to 15 minutes for an uplink to succeed, but on average only takes 3:11. Once uplinked, the Iridium network delivers messages to the ground very quickly with an average of only 12 seconds! Remember that Iridium satellites can talk to one another, so this can really speed things up. Average end-to-end delivery time for Iridium was only 3 minutes, 22 seconds.
| min | max | average | |
| time to uplink | 00:00:04 | 00:15:47 | 00:03:11 |
| time to downlink | 00:00:05 | 00:01:06 | 00:00:12 |
| total time | 00:00:10 | 00:15:53 | 00:03:22 |
Costs
How much does all this cost? First let’s talk about hardware (CapEx). I bought the $500 Swarm evaluation kit, but for an actual IoT deployment, the newer Swarm M138 modem on a breakout board is available from SparkFun for $150, including an antenna and ground plane. An Iridium ROCKBlock modem module can also be bought from SparkFun for $267. If you want the external antenna, that will cost another $70. Overall, an Iridium hardware solution will cost you more.
Also note that since Iridium uses a much higher frequency (1626 MHz), it can get by with a patch antenna or the small GPS-like antenna. The Swarm system uses lower frequencies: downlink 137-138 MHz / uplink 148-149.95 MHz. This requires a larger antenna which is 8 inches or 20cm and a square 8×8 inch ground plane. That will affect the size of your deployed package.
Operational costs are also much lower for Swarm than Iridium. For a $60/year subscription, you can send 750 messages per month, or about 24 per day. That’s a lot of messages. For my Iridium integration, I am using Ground Control (formerly Rock Seven) which is a British company. Their pricing is in GBP, but I’ll convert to USD for comparison. There is a monthly “line rental” fee for about $15 per device. Messages are paid for with “credits” which cost about $0.15 per credit. A message of 50 bytes or less uses one credit. Longer messages will use 2 credits.
To compare apples to apples, let’s say we wanted to send 750 messages per month for one year with Iridium + Ground Control. First line rental would be $15 x 12 = $180. At 15 cents per message, we would spend $1350 for credits, for a yearly total of $1530. Swarm would cost $60 for the same amount of messaging. That’s a big difference. But that’s assuming you are using all of your alloted message capacity with Swarm, and you may not need to send nearly that many messages. So, it really depends on how many messages you need to send. The fewer it is, the less difference there is between both solutions.
Does this cost difference really matter? If you are a hobbyist, yes, money matters. But what if you are a large company using IoT to monitor assets in the field? Maybe your infrastructure is worth millions of dollars. A few thousand dollars here and there for monitoring may not matter at all. But if you are a company deploying thousands of devices? Then Swarm will probably be cheaper. As always, “it depends”.
Summary
Both Swarm and Iridum can be used to create satellite-connected IoT solutions. Swarm is easy to use and lower cost, but the latency for message delivery is significantly longer, potentially several hours. This might be fine for your application.
Iridium is more expensive, but offers much lower latency delivery of messages and can generally be integrated into a smaller hardware package. If you need to monitor expensive infrastructure and want to know about problems as soon as possible, Iridium might be for you. If there is a leak or a fire or anything that needs attention, you’ll want to know in a few minutes, not a few hours.
As is usually the case in engineering, there is no one-size-fits-all answer and as an IoT professional you have some things to consider. I hope this article and the actual experimental results presented is useful. With the rapid proliferation of commercial space ventures, the coming years will bring many new options to the satellite IoT solution space, and we will be watching closely and experimenting as much as we can!
nootropic design, LLC provides custom electronics and IoT solutions for industry.
You can contact us at nootropicdesign [at] gmail.com
Resources
SparkFun: Satellite Transceiver Breakout – Swarm M138
SparkFun: Iridium ROCKBlock 9603N – Iridium SatComm Module
Iridium SBD library for Arduino
Swarm Satellite Arduino Library
GitHub repository containing the source code used to perform the experiements. This is provided for reference only and is not intended to help you replicate the experiements. There is significant setup required on the Swarm Hive and Ground Control management console sites, and I deployed Node-RED endpoints as webhooks to receive messages. Much of the analysis was manual file manipulation and was not automated.
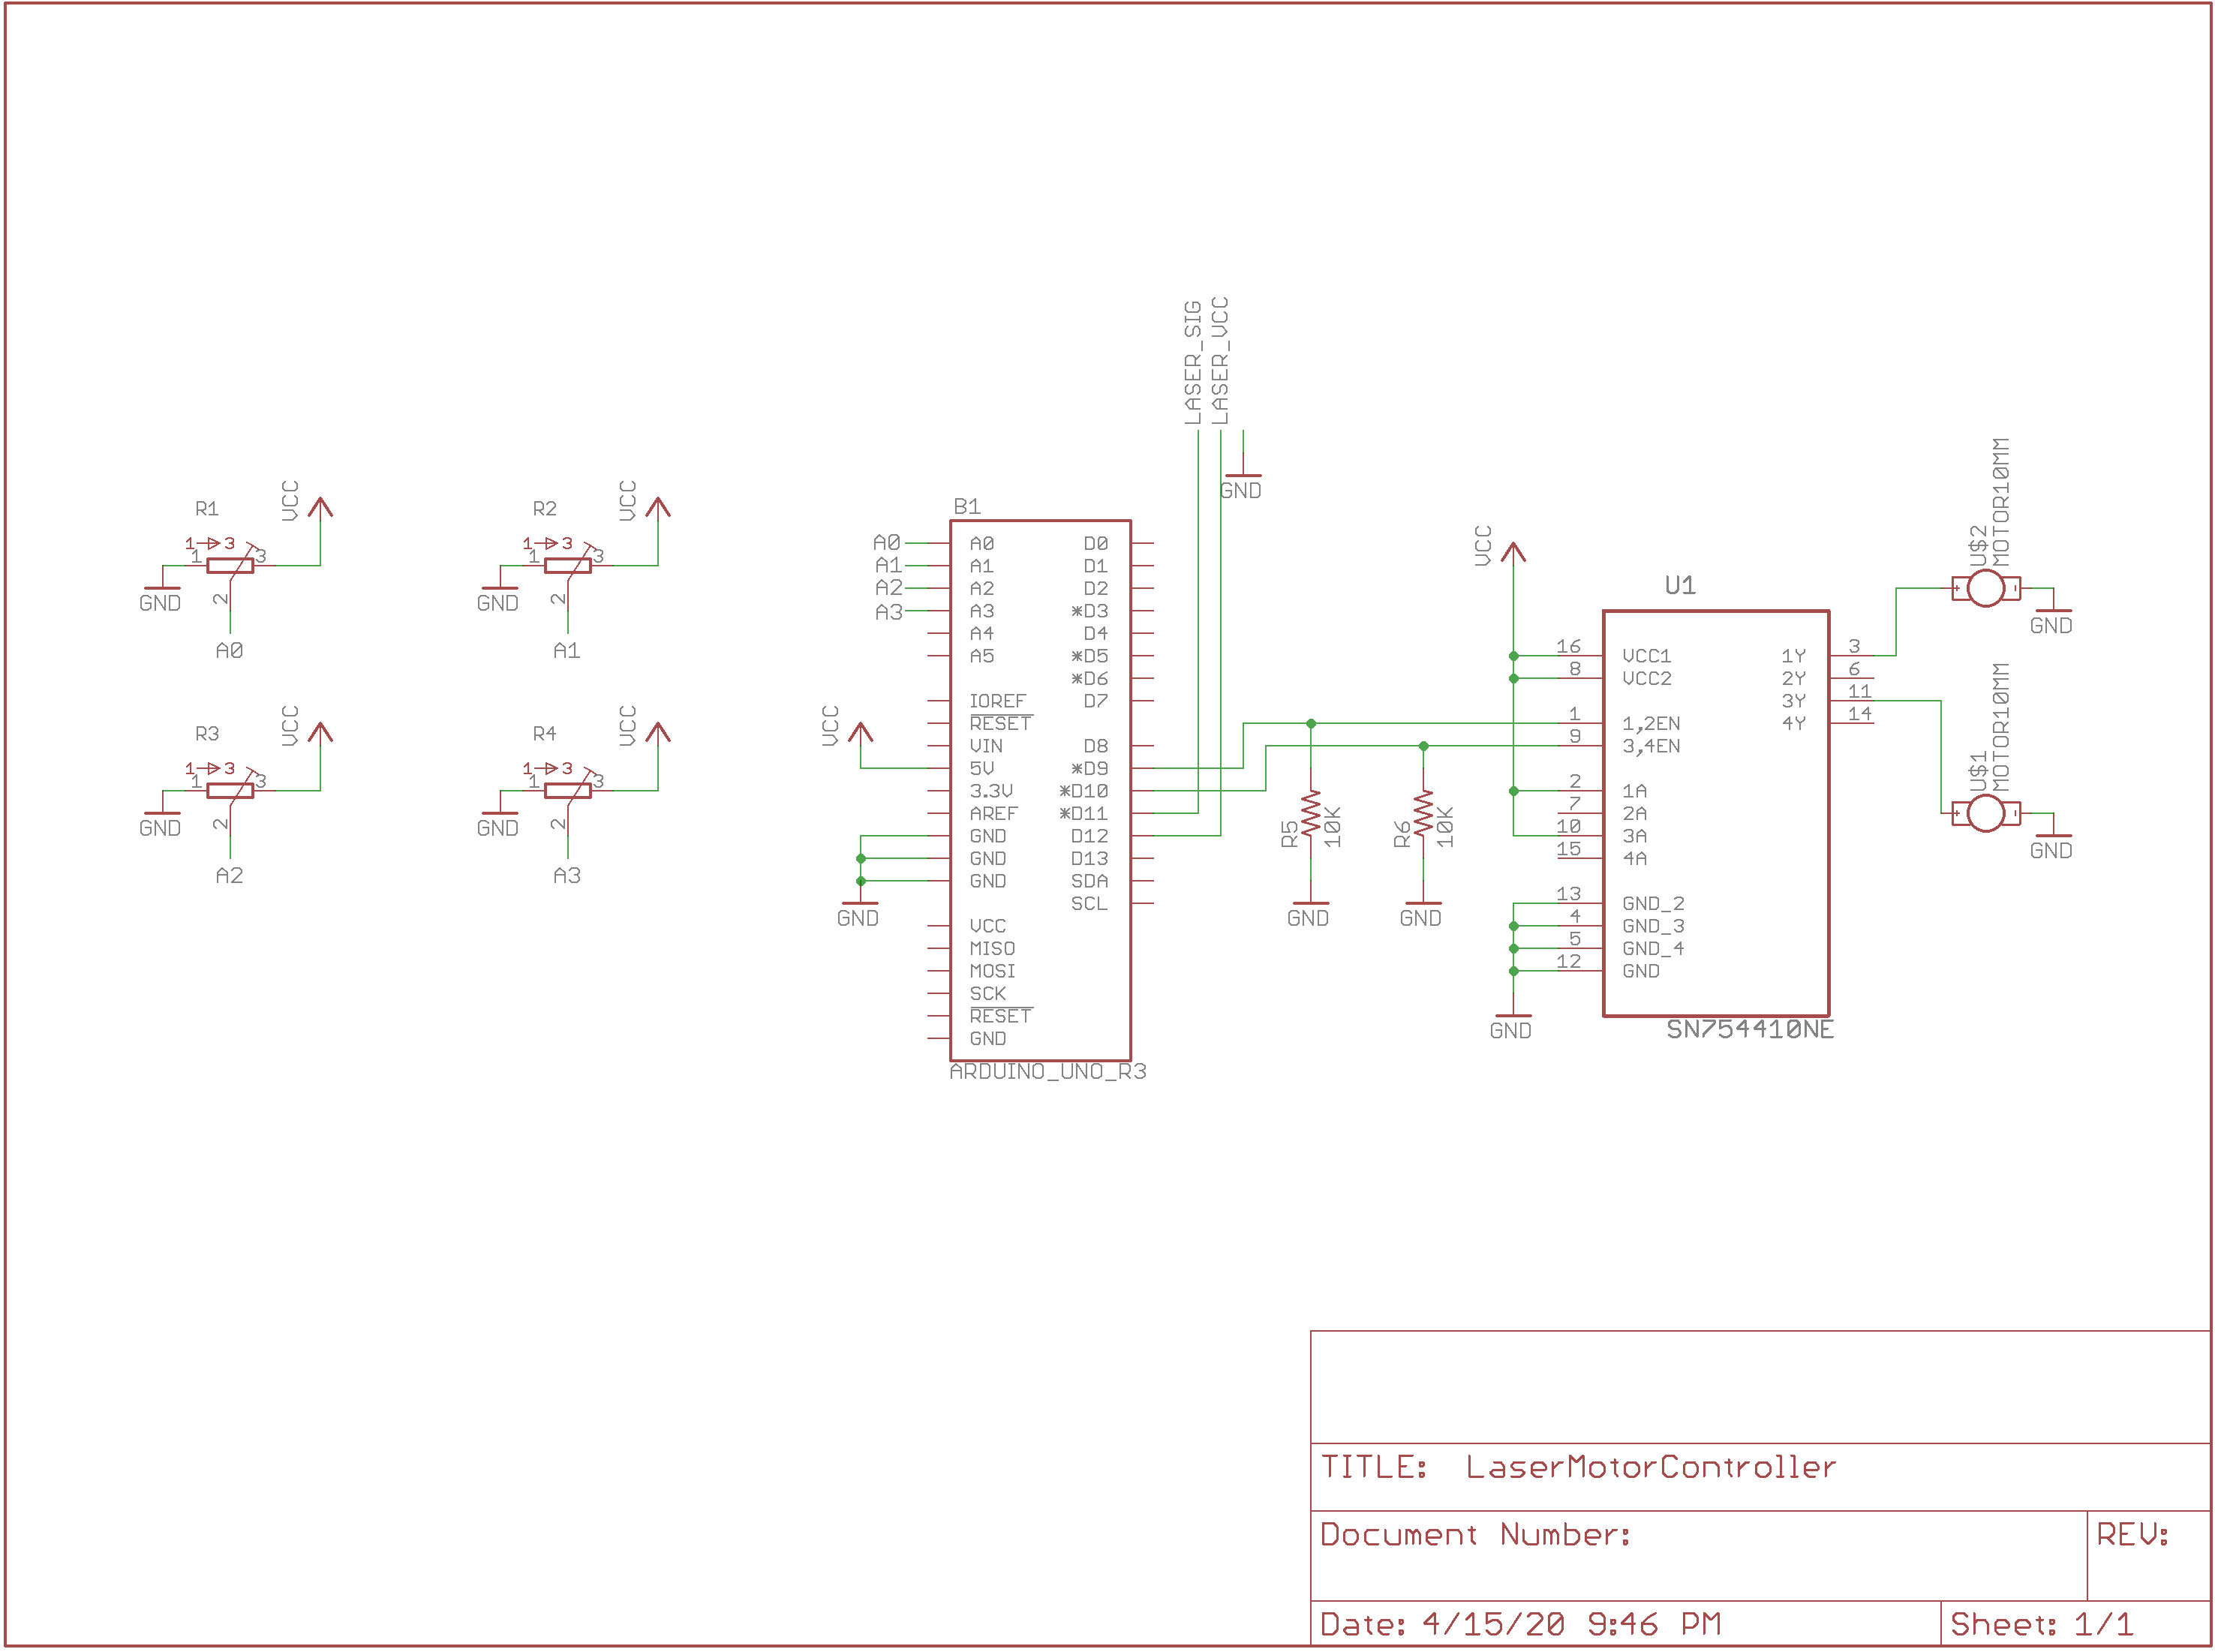
Laser Show Motor Controller
Here’s a fun idea I had while quarantined during the 2020 pandemic. I have a bunch of these cheap laser modules that can easily be driven from an Arduino with 5V, and they only draw 20mA of current. I also have a handful of cheap vibration motors. What happens when you mount vibration motors on a laser? Well, it turns out you can make a cool laser show!
Here’s what I used:
- Arduino
- SN754410 quad half H-bridge chip
- laser module from AliExpress
- 2 cell phone vibration motors from AliExpress
- 4 10K pots to control motor speeds, laser PWM duty cycle, and laser PWM frequency

The motors are mounted perpendicular to one another, and when you change the speed of the motors, the vibrations cause the laser to oscillate in chaotic patterns. They look a lot like Lissajous figures you see on an oscilloscope. This makes sense, of course, because the motors cause periodic oscillations along different axes. There are also pots to control the PWM duty cycle and PWM frequency. This leads to even more interesting visualizations.
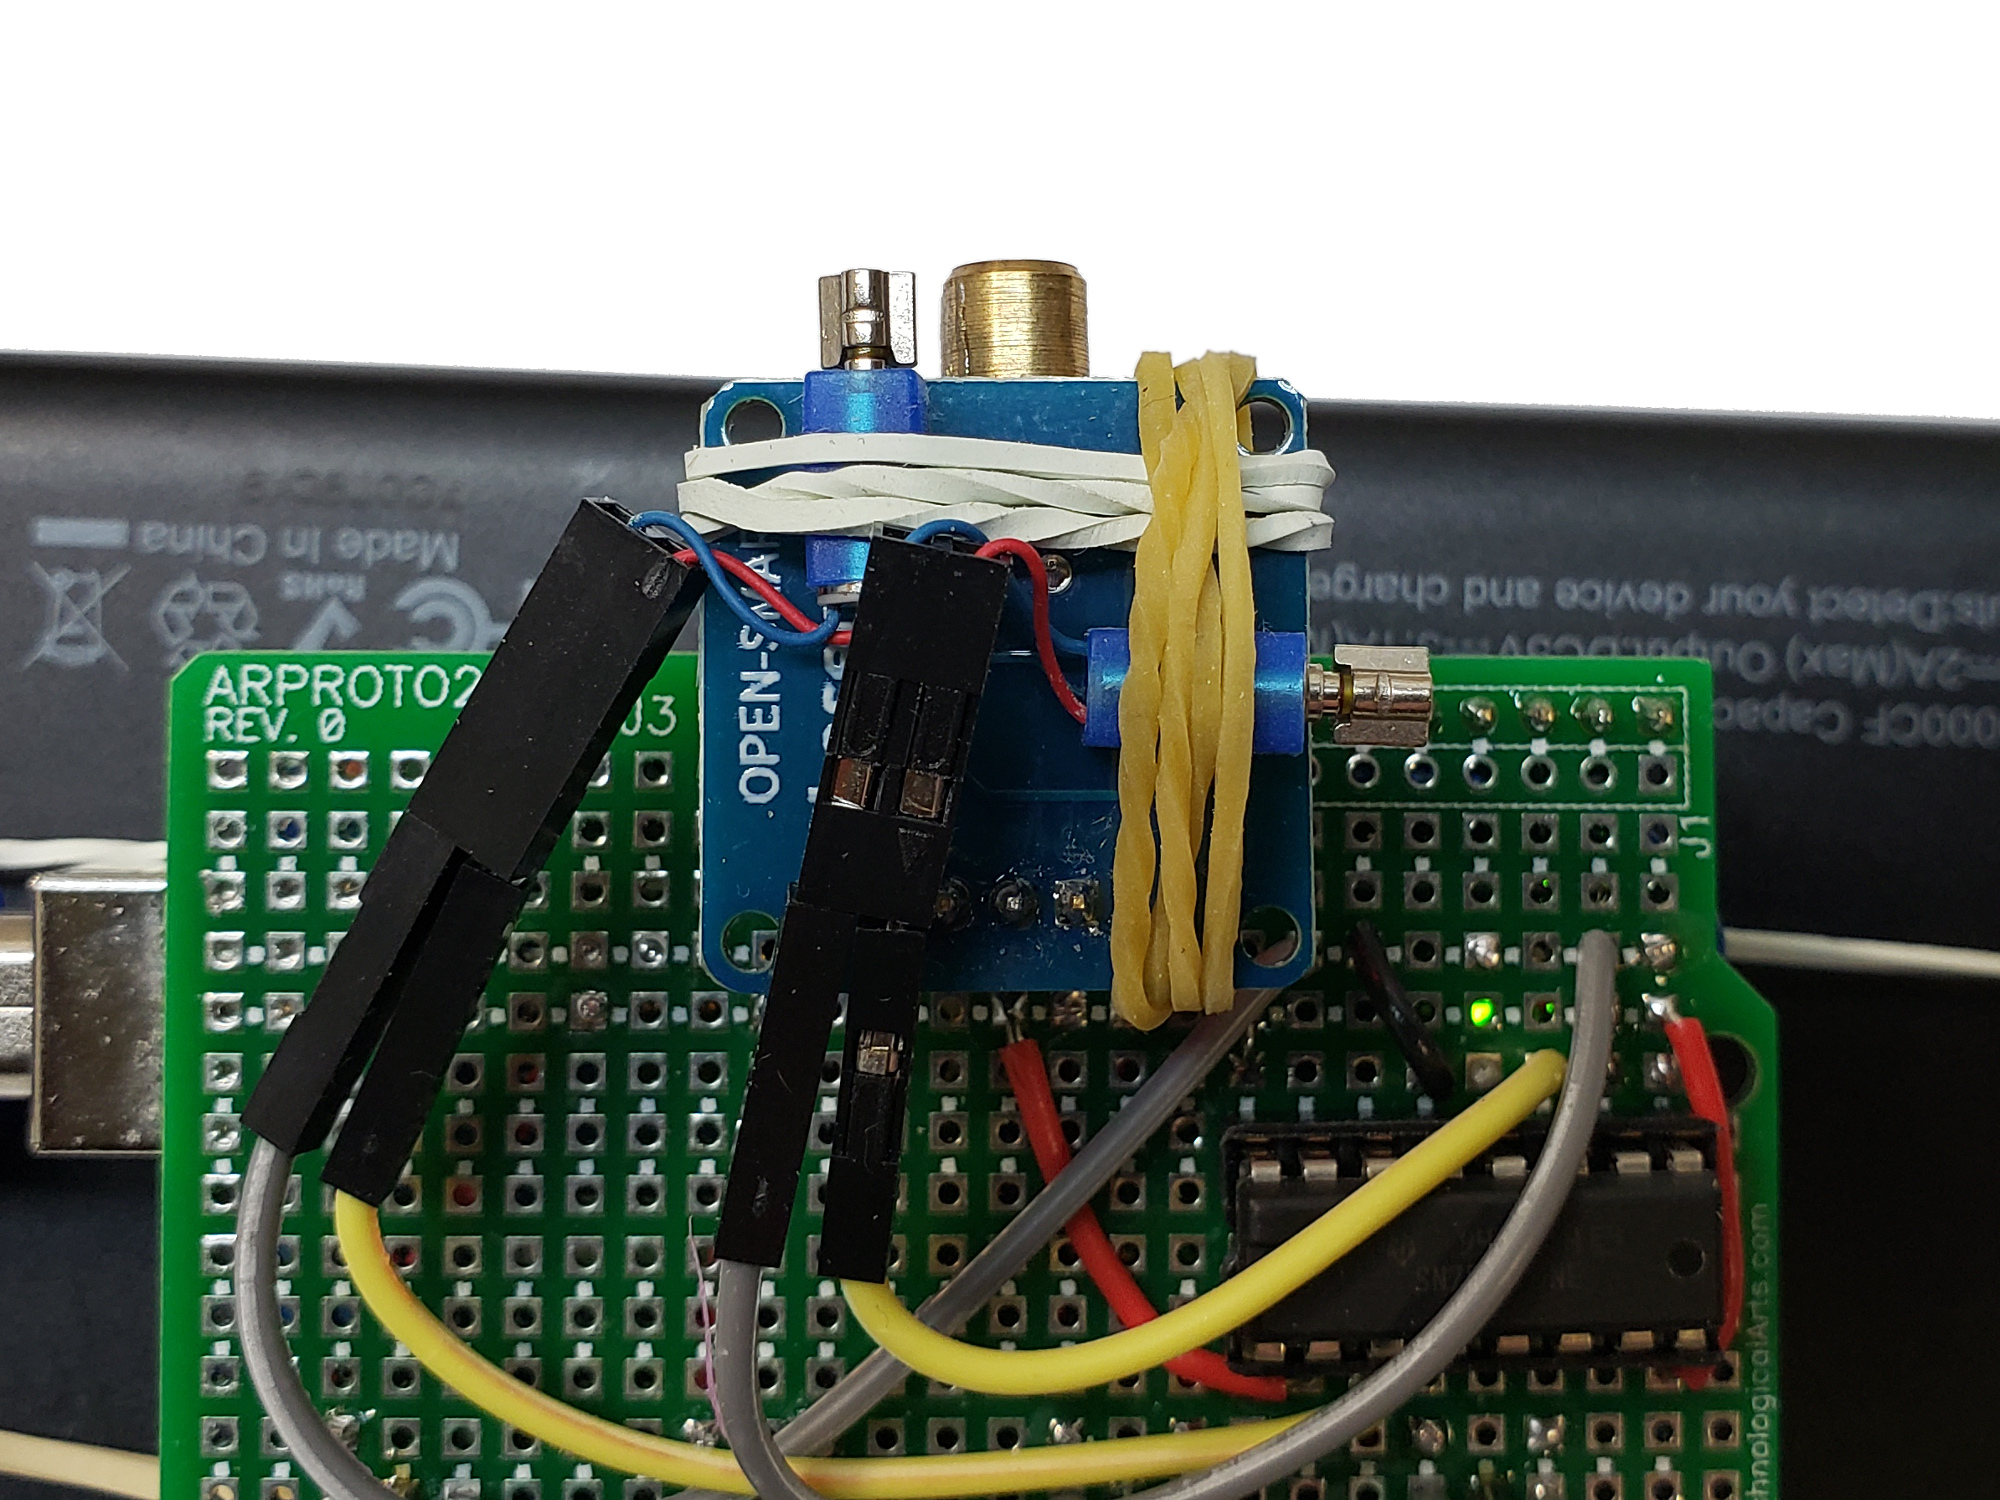
I made the circuit on an Arduino shield prototyping board. I didn’t say it was pretty.
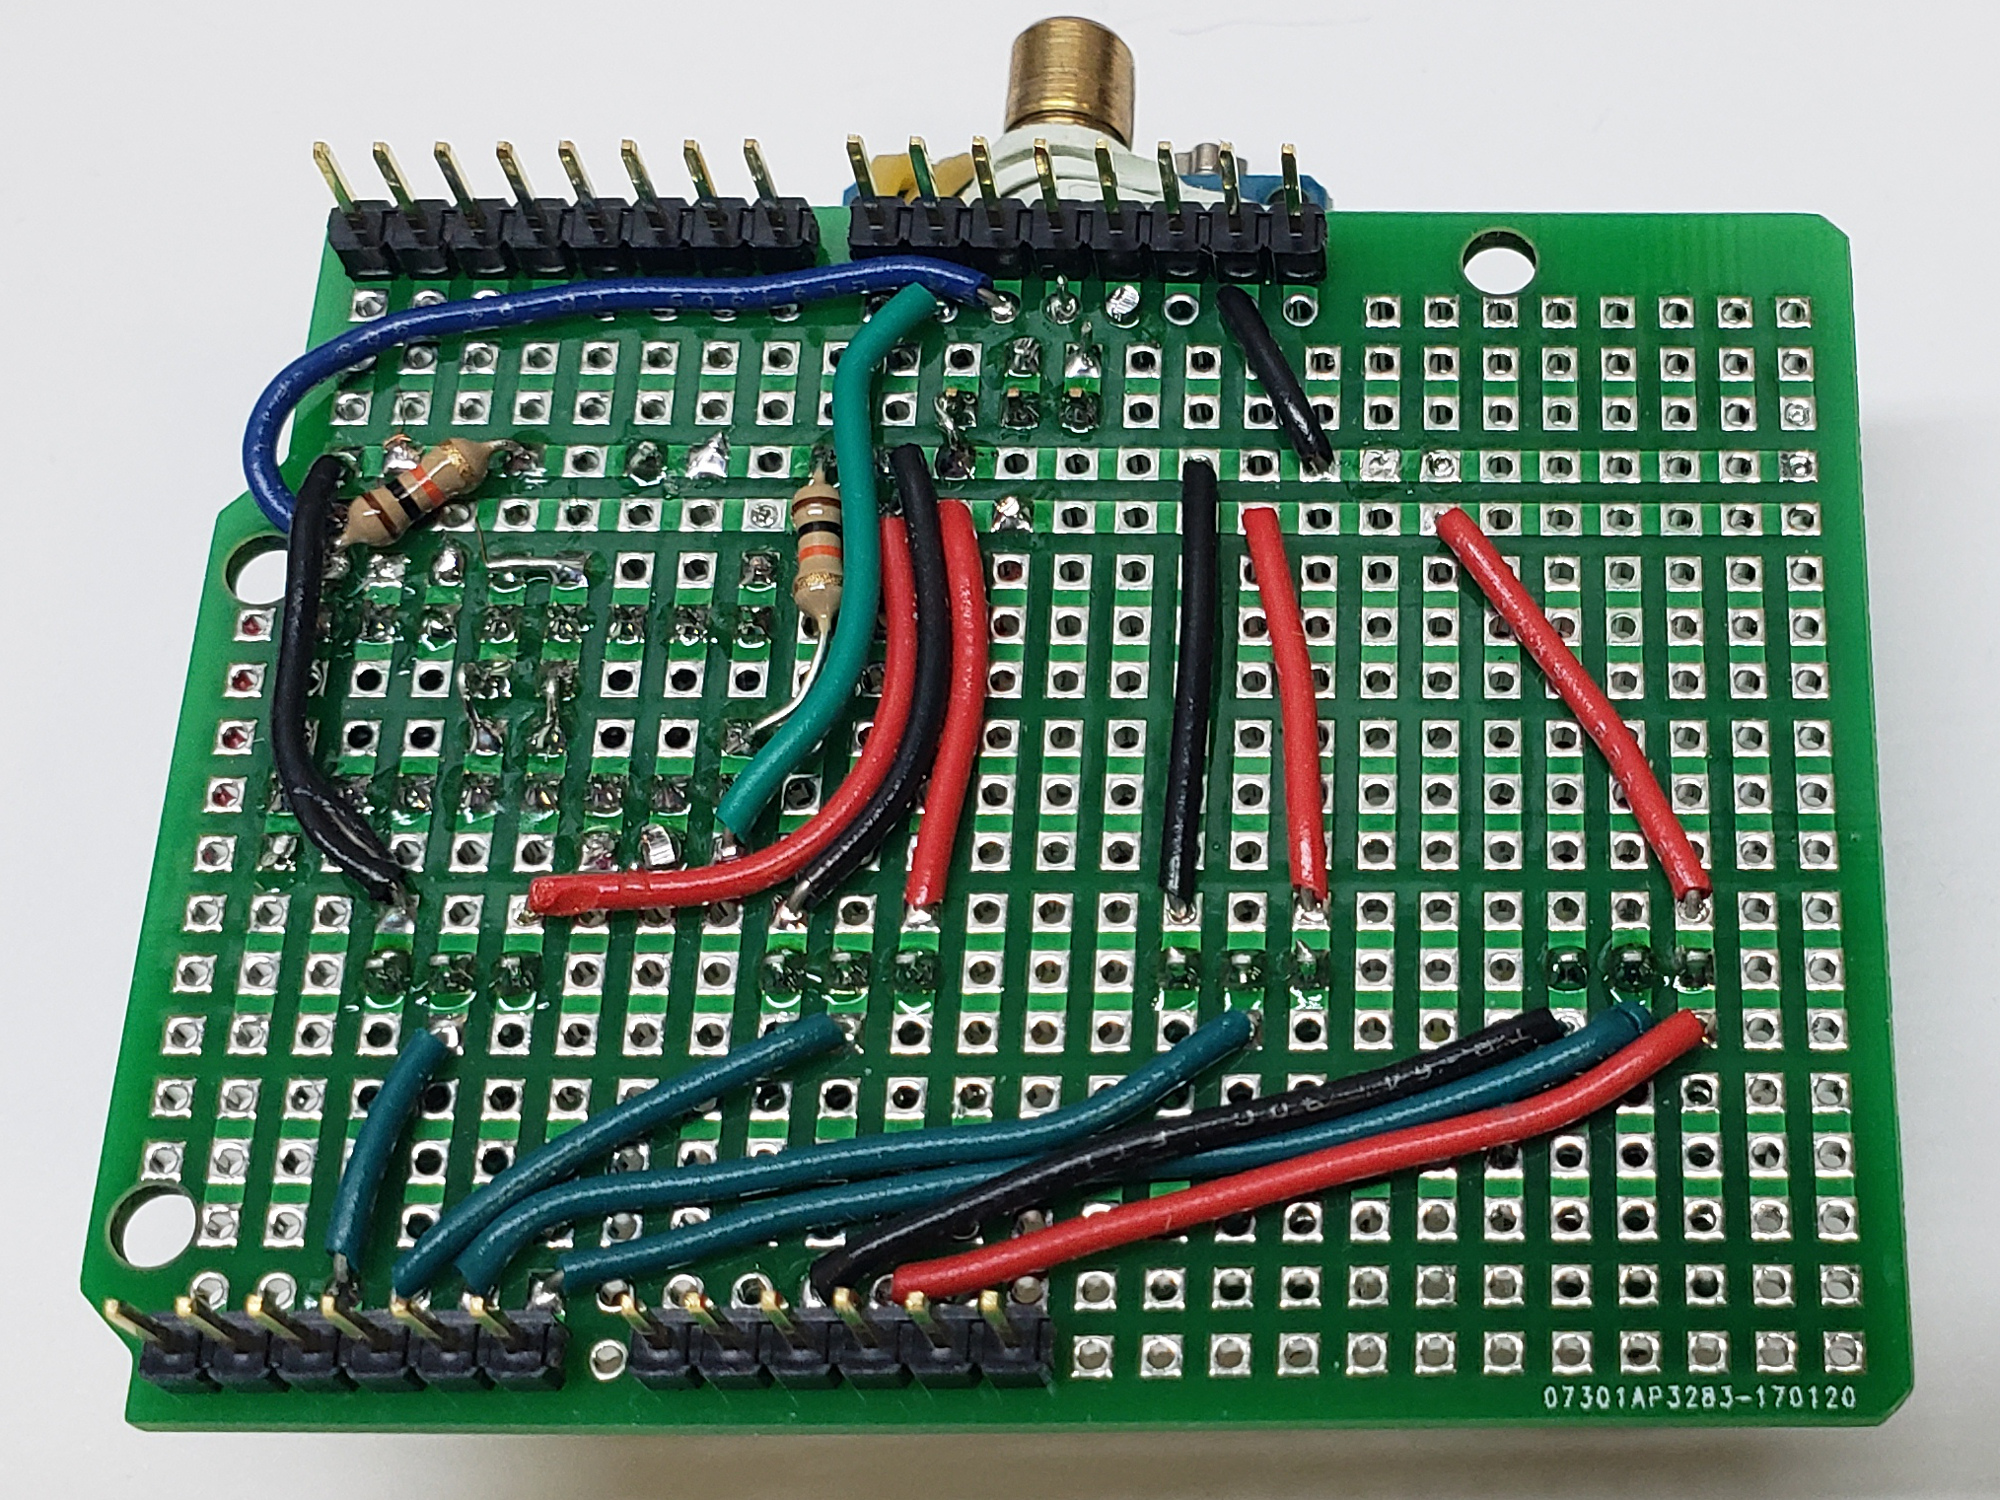
The code is on GitHub, and here is the schematic so you can build it yourself with the things you have lying around. Have fun!
Iridium Satellite Signal Monitoring
Project source code at GitHub: iridium-signal-strength-monitor
In a previous article, I wrote all about Iridium satellite communication for IoT projects using an Iridium modem and simple Arduino technology. However, when trying to send a message to a satellite constellation, you never know if the message will go right away or if it will take several minutes. Sometimes there is a satellite overhead, but sometimes you will have to wait a while before one flies over you. I decided to investigate how the signal strength reported by the Iridium modem (AT+CSQ command) correlates to the actual positions of Iridium satellites. So I used the amazing CesiumJS open source JavaScript library and the hardware I built in the previous project to make a great tool that shows how signal strength matches up with the satellite positions! Understanding the reception quality of satellite constellations is going to become increasingly important as companies like SpaceX roll out their low earth orbit (LEO) Internet connectivity solutions like Starlink.

How It All Works
There’s a lot going on here, so let me explain. First, I deployed my simple development board that I built before but this time I connected an ESP8266 to the serial line so that it could send information to the Internet. The Arduino code on the dev board uses the Iridium SBD library to ask the modem for the “signal strength” that it has at the moment. This gives a value from 0-5. It writes this info over serial to the ESP8266 which publishes it to an MQTT topic. So basically this sits outside with the antenna pointed to the sky and asks the modem every 5 seconds what the signal strength is. The GPS module allows me to attach an accurate timestamp to the reading so that the data can be matched up with the satellite position info.
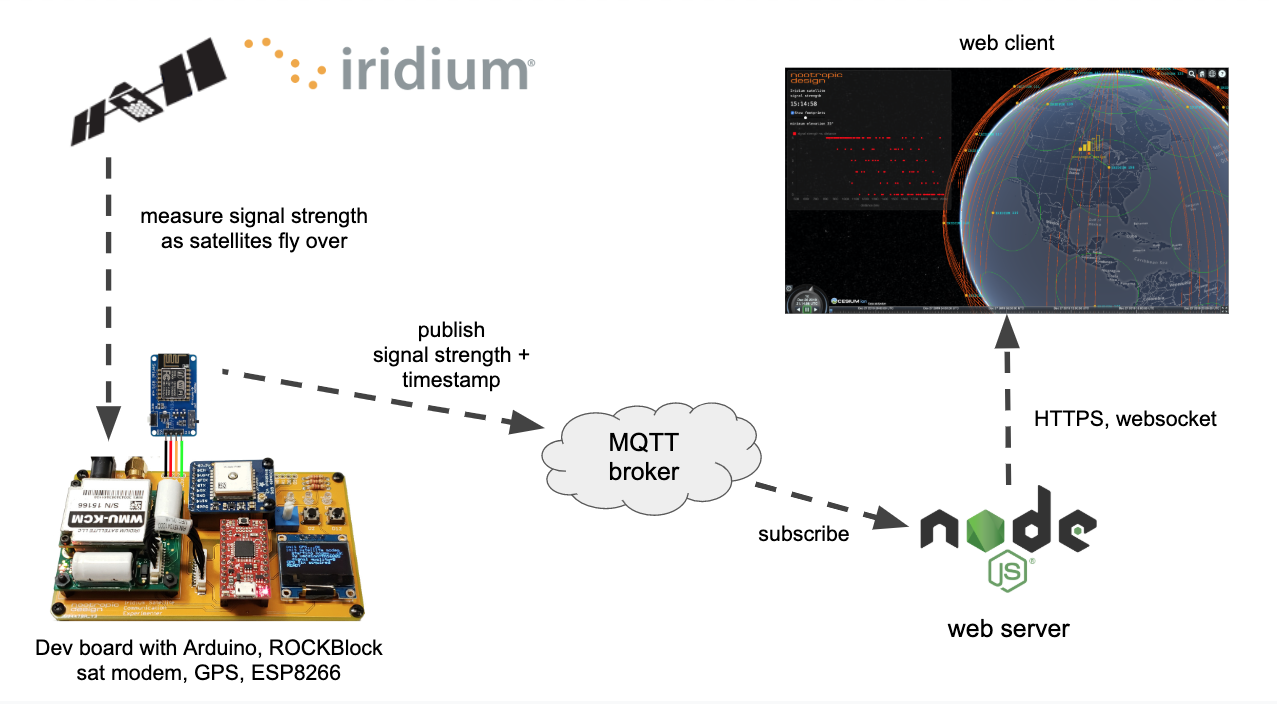
On the software side, I wrote a web tool using CesiumJS that displays the orbits of all the Iridium satellites. It calculates the orbits from the Iridium two-line element sets (TLEs) from Celestrak. CesiumJS is a great way to visualize orbits and show the positions of satellites in realtime. You can zoom in, pan and tilt the globe, OMG it’s just gorgeous. The web client is served up from a simple NodeJS server that also subscribes to the MQTT topic to get the signal strength data as the hardware publishes it. The server sends the data up a websocket to the web client.
In addition to showing the realtime satellite positions and predicted orbits, the web tool also:
- displays the current signal strength as 5 bars, just like your phone
- calculates the closest satellite to the ground station and renders a green line to it
- displays the footprint of each satellite. You can change the elevation angle using a slider. When set to zero, the footprint represents visibility to the horizon. I have found that setting this to 25 degrees gives a more accurate depiction of the satellite’s communication range. That is, my hardware can “hear” the satellite if it is at least 25 degrees above the horizon.
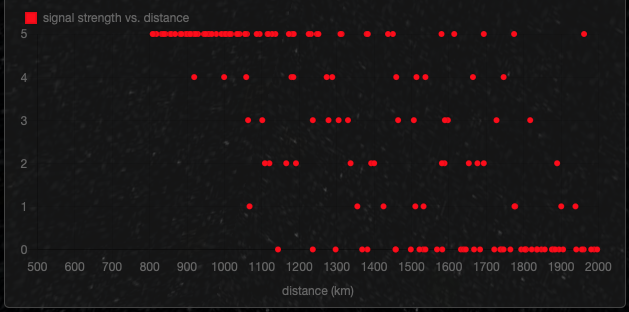
- plots the signal strength vs. the distance to the closest satellite on a scatter plot. This should show that higher signal readings are correlated with shorter distances to the closest satellite.
Results
Well, does it work? Does the signal strength reported by the modem correspond to the actual proximity of an Iridium satellite? Yes, it does! It’s not perfect, but this is RF, so one should not expect perfectly predictable measurements. There are all kinds of factors at play in RF propagation. But generally speaking, I measure zero bars when there are no satellites overhead, and measure a stronger and stronger signal as a satellite approaches. The scatter plot that is built up over time definitely shows that strong signals (vertical axis) are associated with smaller distance to the closest satellite (horizontal axis).
This video shows the experiment in action. The great thing about building a CesiumJS model is the ability to have all the data stored in a time series that you can play back at different speeds and even play it backward. Since satellites move slowly, it’s very helpful to back up in time and play the sequence forward at higher speeds. And it looks beautiful, too!
Software
You can try this yourself if you have an Iridium modem like the RockBLOCK 9603 modem. Or you can use the CesiumJS orbit visualization for your own projects. GitHub repo: iridium-signal-strength-monitor
Even if you don’t have the hardware to measure signal strength, you can use the the CesiumJS web application to show the realtime positions of Iridium satellites.
Here are some things you will need to change in the software if you want to do this project:
In the code for the ESP8266 MQTTWiFiGateway.ino:
const char* mqtt_server = "your_mqtt_server";
const char* mqtt_username = "mqtt_user";
const char* mqtt_password = "mqtt_password";
For the webserver and CesiumJS web application, set your MQTT server and credentials in server.js:
var options = {
    host: 'your_mqtt_server',
    port: 1883,
    username: 'mqtt_user',
    password: 'mqtt_password'
}
You will need to get a Cesium Ion access token. It’s free.
Set your Cesium Ion access token in app.js:
Cesium.Ion.defaultAccessToken = 'YOUR_CESIUM_ION_ACCESS_TOKEN';
To use the MapBox dark imagery like I did, you’ll need to get a MapBox access token. Also set in app.js:
imageryProvider : new Cesium.MapboxImageryProvider({
    mapId: 'mapbox.dark',
    accessToken: 'YOUR_MAPBOX_ACCESS_TOKEN'
})
Installation and startup:
cd webserver
npm install
npm start
Automated Weather Satellite Ground Station
UPDATE: All NOAA APT satellites (NOAA-18, NOAA-19, NOAA-15) were decommissioned in 2025. NOAA-15 was decommissioned and stopped transmitting imagery at 15:28 UTC on August 19. You can see my very last received images on my site.
Project source code at GitHub: wx-ground-station

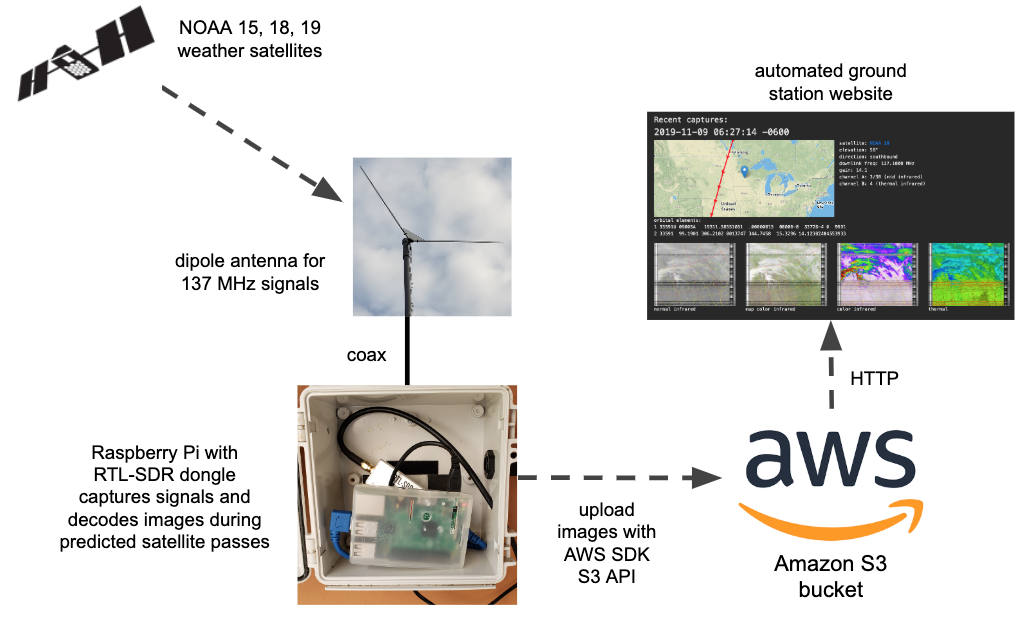
This project will show you how to create a fully automated ground station that will receive and decode NOAA weather satellite images and upload them to your own website served from an Amazon AWS S3 bucket. With this project you don’t need your own server or have to run your own website infrastructure. Have a look at my AWS site that is updated automatically all day long.
Oh, you want a site like this, too? Full of images you decoded from space? Then let’s get started, my friend.
Here’s what you’ll need:
- a modern Raspberry Pi (version 3 or 4), probably with Wi-Fi since it may be deployed outdoors. I used a RPi 3 model B. I have heard that a RPi Zero may not be powerful enough.
- an RTL-SDR dongle. I recommend the RTL-SDR V3 dongle from the excellent RTL-SDR.COM blog.
- an AWS account for hosting images and web content in an Amazon S3 bucket. You can sign up for the free tier for a year, and it’s still cheap after that.
- a simple dipole antenna with elements 21 inches (53.4 cm) long and that can be adjusted to have a 120 degree angle between the elements. Here’s a great article on design or you can just buy this dipole kit, also from the RTL-SDR.COM blog.
- coaxial cable to go from your antenna to Raspberry Pi + RTL-SDR dongle. The dipole antenna kit comes with 3m of RG174 coax, but I used 10 feet of RG58 coax.
This is a very long article with lots of steps, so take your time — I won’t be able to help everyone debug all their issues. I won’t go into the details of using a Raspberry Pi for the first time — this project assumes you know your way around the Pi and are comfortable with installing software on it. If you have never used AWS before, I suggest you set up an account and get familiar with what S3 is.
Weather Satellites and RTL-SDR
This probably isn’t the first you’ve read about using a software defined radio (SDR) to receive weather satellite images. This type of project has been documented before. Sometimes the emphasis is on software defined radio hardware and techniques, sometimes it’s about antenna design, or maybe the article is written by a real weather enthusiast who always use the abbreviation “wx” for weather. I’m not an expert in any of these areas, but the idea of receiving images directly from weather satellites as they fly overhead has intrigued me for many years. This has all gotten a lot easier with RTL-SDR dongles, more powerful Raspberry Pi computers and simpler antenna designs that get the job done. I gave this project a try recently using this well-written Instructables article, a totally hacked-together antenna I made, and a very old rtl-sdr dongle:
and on my very first attempt, I decoded this image from NOAA19 as it passed over my area:
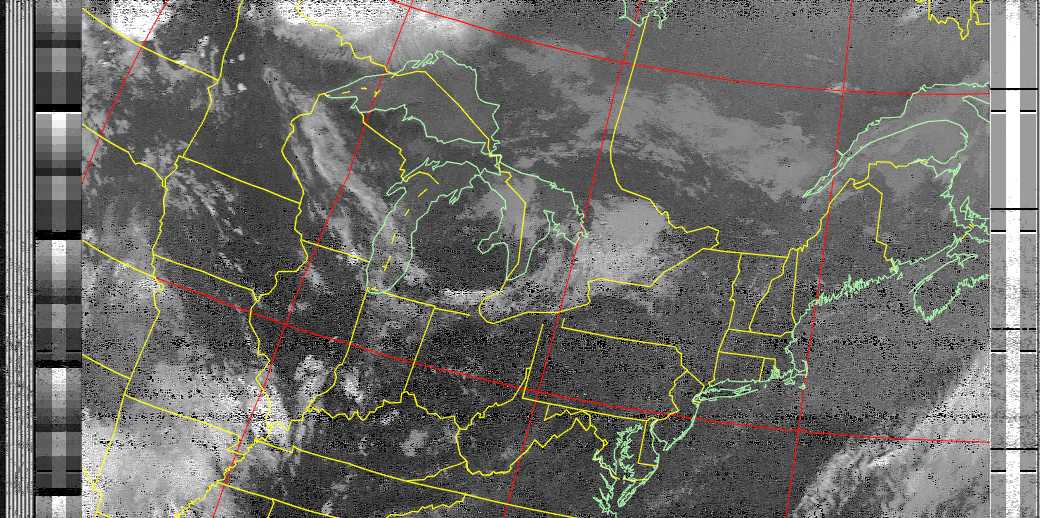
From that moment, I was hooked. I played around with different antennas and such, but found it tedious to always copy the images from my outdoor Raspberry Pi to my computer so I could look at them. I resolved to automate the uploading of images to an S3 bucket and to improve upon the scripts from the Instructables article. This is the overall solution:
Amazon AWS Setup
Your ground station website functionality will be completely in client-side JavaScript. It will use the AWS JavaScript SDK to make API calls to S3. The scripts that run on the Raspberry Pi also use some Node.js scripts to upload to S3. There are a lot of steps to get everything set up:
AWS SDK Credentials
The scripts that run on the Raspberry Pi use some Node.js scripts and the AWS JavaScript SDK to upload to S3. You need to get your credentials. These two articles show you how to get your credentials and store them for Node.js access:
Getting your credentials
Loading Credentials in Node.js from the Shared Credentials File
Your credentials file on the Raspberry Pi ~/.aws/credentials will look like this:
[default]
aws_access_key_id = YOUR_ACCESS_KEY_ID
aws_secret_access_key = YOUR_SECRET_ACCESS_KEY
Also set the default region where your S3 bucket will reside in ~/.aws/config. For example:
[default]
output = json
region = us-west-2
Create an S3 Bucket
Now create an S3 bucket for public website hosting. I’m using the bucket name nootropicdesign.wx for mine. The instructions are in this article:
Setting up a Static Website
At this point you should be able to load a simple web site from your new bucket. You might want to upload a simple index.html file and try to load it in your browser with http://BUCKETNAME.s3-website-REGION.amazonaws.com/.
<!doctype html>
<html>
  <head><title>S3 test</title></head>
  <body>Hello from S3</body>
</html>
Create an Identity Pool in Cognito
To give public users the ability to access your S3 bucket using the AWS SDK, you need to set up an identity pool and create a policy allowing them read access to your bucket. This is done using Amazon Cognito. A good guide for granting public access to your bucket is described in this article that shows how to serve images from an S3 bucket (just like we are). It’s somewhat confusing to follow the steps, so take your time.
Step 1: create an Amazon Cognito identity pool called “wx image users” and enable access to unauthenticated identities. Be sure to select the region in the upper right of the page that matches the region where your S3 bucket was created! Make note of the role name for unauthorized users, e.g. “Cognito_wximageusersUnauth_Role“.
Step 2: on the Sample Code page, select JavaScript from the Platform list. Save this code somewhere, because we need to add it to the web content later. It looks something like this:
// Initialize the Amazon Cognito credentials provider
AWS.config.region = 'us-west-2'; // Region
AWS.config.credentials = new AWS.CognitoIdentityCredentials({
  IdentityPoolId: 'us-west-2:1d02ae39-3a06-497e-b63c-799a070dd09d',
});
Step 3: Add a Policy to the Created IAM Role. In IAM console, choose Policies. Click Create Policy, then click the JSON tab and add this, substituting BUCKET_NAME with your bucket name.
{
   "Version": "2012-10-17",
   "Statement": [
      {
         "Effect": "Allow",
         "Action": [
            "s3:ListBucket"
         ],
         "Resource": [
            "arn:aws:s3:::BUCKET_NAME"
         ]
      }
   ]
}
Click Review policy and give your policy a name, like wxImagePolicy.
In IAM console, click Roles, then choose the unauthenticated user role previously created when the identity pool was created (e.g. Cognito_wximageusersUnauth_Role). Click Attach Policies. From the Filter policies menu, select Customer managed. This will show the policy you created above. Select it and click Attach policy.
Step 4. Set CORS configuration on the S3 bucket. In the S3 console for your bucket, select Permissions, then CORS configuration.
<?xml version="1.0" encoding="UTF-8"?>
<CORSConfiguration xmlns="http://s3.amazonaws.com/doc/2006-03-01/">
    <CORSRule>
        <AllowedOrigin>*</AllowedOrigin>
        <AllowedMethod>GET</AllowedMethod>
        <AllowedMethod>HEAD</AllowedMethod>
        <AllowedHeader>*</AllowedHeader>
    </CORSRule>
</CORSConfiguration>
Raspberry Pi Setup
Most of these instructions are from steps are from steps 2 and 3 of the Instructables article I mentioned earlier.
Install Required Packages
First, make sure your Raspberry Pi is up to date:
sudo apt-get update
sudo apt-get upgrade
sudo reboot
Then install a set of of required packages.
sudo apt-get install libusb-1.0
sudo apt-get install cmake
sudo apt-get install sox
sudo apt-get install at
sudo apt-get install predict
I used Node.js in some of the scripting, so if you don’t have node and npm installed, you’ll need to do that. In depth details are here, and I easily installed with:
curl -sL https://deb.nodesource.com/setup_10.x | sudo -E bash -
sudo apt-get install -y nodejs
Using your favorite editor as root (e.g. sudo vi), create a file /etc/modprobe.d/no-rtl.conf and add these contents:
blacklist dvb_usb_rtl28xxu
blacklist rtl2832
blacklist rtl2830
Build rtl-sdr
Even if you have rtl-sdr already built and installed, it’s important to use the version in the GitHub repo keenerd/rtl-sdr, as this version’s rtl_fm command can create the WAV file header needed to decode the data with sox.
cd ~
git clone https://github.com/keenerd/rtl-sdr.git
cd rtl-sdr/
mkdir build
cd build
cmake ../ -DINSTALL_UDEV_RULES=ON
make
sudo make install
sudo ldconfig
cd ~
sudo cp ./rtl-sdr/rtl-sdr.rules /etc/udev/rules.d/
sudo reboot
Install and Configure wxtoimg
The program wxtoimg is what does the heavy lifting in this project. It decodes the audio files received by the RTL-SDR receiver and converts the data to images. The original author of wxtoimg has abandoned the project, but it is mirrored at wxtoimgrestored.xyz.
wget https://wxtoimgrestored.xyz/beta/wxtoimg-armhf-2.11.2-beta.deb
sudo dpkg -i wxtoimg-armhf-2.11.2-beta.deb
Now run wxtoimg once to accept the license agreement.
wxtoimg
Create a file ~/.wxtoimgrc with the location of your base station. As usual, negative latitude is southern hemisphere, and negative longitude is western hemisphere. Here’s my location in Minnesota, USA.
Latitude: 45.0468
Longitude: -93.4747
Altitude: 315
The program predict is used by the automated scripts to predict weather satellite orbits. Run predict to bring up the main menu:
                           --== PREDICT  v2.2.3 ==--
                     Released by John A. Magliacane, KD2BD
                                    May 2006


                            --==[ Main Menu ]==--


 [P]: Predict Satellite Passes          [I]: Program Information
 [V]: Predict Visible Passes            [G]: Edit Ground Station Information
 [S]: Solar Illumination Predictions    [D]: Display Satellite Orbital Data
 [L]: Lunar Predictions                 [U]: Update Sat Elements From File
 [O]: Solar Predictions                 [E]: Manually Edit Orbital Elements
 [T]: Single Satellite Tracking Mode    [B]: Edit Transponder Database
 [M]: Multi-Satellite Tracking Mode     [Q]: Exit PREDICT
Select option ‘G’ from the menu to set your ground station location:
                *  Ground Station Location Editing Utility  *


                        Station Callsign  : KD0WUV
                        Station Latitude  : 45.0468 [DegN]
                        Station Longitude : 93.4747 [DegW]
                        Station Altitude  : 315 [m]


            Enter the callsign or identifier of your ground station
You can enter whatever you want for the callsign (I used my amateur radio callsign). When entering the longitude, note that positive numbers are for the western hemisphere and negative numbers are for the eastern hemisphere. This is opposite convention, so make sure you get this right or you’ll be listening when there’s no satellite overhead!
Get the Automation Scripts and Configure
I’ve completely refactored the scripts originally posted in the Instructables article and added Node.js scripts for creating thumbnail images and uploading all images to S3. The git repo can be cloned anywhere on your Raspberry Pi. The configure.sh script sets the installation directory in the scripts and schedules a cron job to run the satellite pass scheduler job at midnight every night.
git clone https://github.com/nootropicdesign/wx-ground-station.git
cd wx-ground-station
sh configure.sh
cd aws-s3
npm install
In the file aws-s3/upload-wx-images.js set REGION, BUCKET, and LOCATION to the correct values. This Node.js script prepares the images for upload by creating thumbnail images, printing some metadata on the images, and creating a JSON metadata file for each image capture. The LOCATION string will be printed on the images that you capture. Here are my values just for reference.
var REGION = "us-west-2";
var BUCKET = "nootropicdesign.wx";
var LOCATION = "nootropic design ground station, Plymouth, Minnesota, USA  45.0468, -93.4747";
Also set the REGION and BUCKET correctly in the files aws-s3/upload-upcoming-passes.js and aws-s3/remove-wx-images.js. Plug in your own values:
var REGION = "us-west-2";
var BUCKET = "nootropicdesign.wx";
Now we need to make some changes to the web content. The web interface uses Mapbox to draw the live maps of the next upcoming satellite pass. You’ll need to create an account at Mapbox to get an access token. Their free tier lets you load 50,000 maps/month, so you are not likely to have any real costs. When logged into Mapbox, get your account token from https://account.mapbox.com/.
Now in the file website/wx-ground-station.js, set your bucket name, AWS region, AWS credentials (the Cognito identity pool info you saved above), Mapbox token, and your ground station info. Some of my values are shown here for reference.
var bucketName = 'nootropicdesign.wx';
AWS.config.region = 'us-west-2'; // Region
AWS.config.credentials = new AWS.CognitoIdentityCredentials({
    IdentityPoolId: 'us-west-2:1d02ae39-30a6-497e-b066-795f070de089'
});

// Create a mapbox.com account and get access token
const MAP_BOX_ACCESS_TOKEN = 'YOUR_MAPBOX_TOKEN';
const GROUND_STATION_LAT =  45.0468;
const GROUND_STATION_LON = -93.4747;
const GROUND_STATION_NAME = 'my ground station';
Upload the Web Content to S3
Upload the the contents of the website directory to your S3 bucket using the S3 console. Since you probably edited the files on your Raspberry Pi, you might need to copy them to your computer where you are accessing AWS using a browser. Whatever the case, these files need to be uploaded to the top level of your bucket. IMPORTANT: be sure to grant public access to the files when you upload them!
index.html
wx-ground-station.js
tle.js
logo.png
Of course, you can replace logo.png with your own, or just remove the <img> tag from index.html.
Test Everything Out
Now that everything is configured, let’s run the scheduling script to schedule recording of upcoming satellite passes. This way you can have a look today instead of waiting until they get scheduled at midnight. This step will also upload a JSON file with the upcoming passes info to your website.
cd wx-ground-station
./schedule_all.sh
You can now visit your AWS S3 website endpoint at
http://BUCKETNAME.s3-website-REGION.amazonaws.com/
Once again, mine is here: http://nootropicdesign.wx.s3-website-us-west-2.amazonaws.com/
Even though you don’t have any images captured, you should be able to see the next upcoming pass. The next thing to do is make sure the scripts work correctly to record the audio file, process it into images, and upload to your bucket. You can watch the logs in the wx-ground-station/logs to debug any errors.
The wxtoimg enhancements that are displayed depends on what sensors were active when the images were captured. If sensors 3 and 4 were active (usually at night), then the thermal enhancement will be shown. Otherwise a multispectral analysis enhancement will be shown.
Not all images you capture will be good. I feel lucky if even half of my satellite passes produce recognizable images. You can clean up bad ones by using the script aws-s3/remove-wx-images on the Raspberry Pi. Just provide the key to the particular capture as an argument to remove all the images and the metadata from the S3 bucket.
node aws-s3/remove-wx-images NOAA19-20191108-162650
Hopefully in the next few hours you’ll be able to see some images uploaded, depending on when satellites are scheduled to fly over. You may get up to 12 passes per day, usually 2 for each of the NOAA satellites in the morning, then 2 more for each of them in the evening. Let us know if this project worked for you!
Fine Tuning
The script receive_and_process_satellite.sh uses the rtl_fm command to read the signal from the RTL-SDR receiver. The -p argument sets the PPM error correction. I have mine set to 0, but you may want to adjust. See this article for details.
I have also installed a low noise amplifier (LNA) to improve my reception (results are mixed). My LNA can be powered with a bias tee circuit and controlled with the rtl_biast command. If you are using an LNA like this, you can install rtl_biast as documented here and uncomment the rtl_biast lines in receive_and_process_satellite.sh which turn the LNA on and off.
Iridium Satellite Communication with Arduino
Note: Rock7 Communications is now Ground Control
When deploying a microcontroller-based IoT solution or just doing experiments gathering data in the field, you often need a way to get the data back to your home base or to the cloud somehow. You’ve probably used WiFi, maybe dabbled with cellular solutions, but what about satellite communication? Sometimes satellite is the only option if you are in a remote area. Transmitting data via satellite has been possible for quite some time using a satellite modem like the RockBLOCK 9603 from Ground Control (previously Rock Seven Communications). I recently used this technology to build a solution for a customer, and it was SO FUN I wanted to write up something about it because there’s not very much info out there.
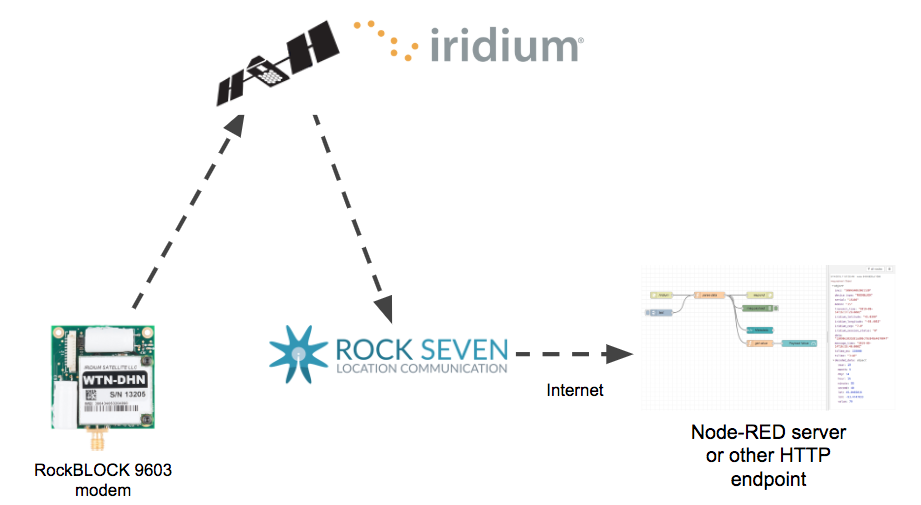
Here is the basic architecture of the solution. Data is transmitted to one of the 66 Iridium satellites and then downlinked to Rock Seven where it will then be sent over the Internet to your server via HTTP or even email. I’m using a Node-RED server as the destination endpoint.
One barrier is cost: the RockBLOCK 9603 costs $250, you’ll pay a monthly fee to keep the modem activated, and each message costs money. I’ll give more details on cost later, but if you have a mission critical system that needs to be monitored or controlled in a remote area, it can be easy to justify the costs. From a development perspective, the good news is that there is an excellent Arduino library called IridiumSBD that makes it very easy to send Iridium short burst data messages (full documentation here). You will also want to keep in mind that messages need to be short (few hundred bytes at most) and that sending a message can take several minutes. We’re not streaming video with this stuff.
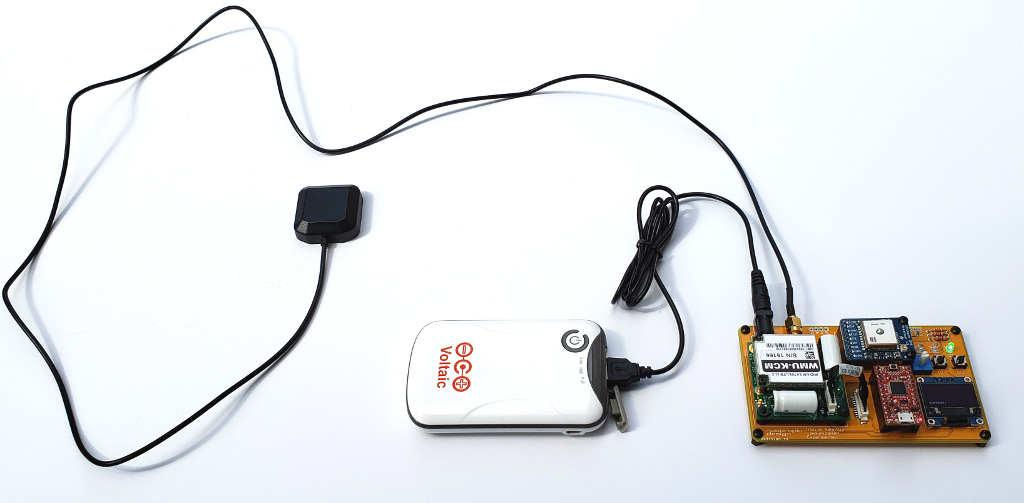
Hardware
After I learned this technology, I decided to make a simple development board to make it easier to deal with the wiring and make it more portable. The RockBLOCK modem has a 10-pin Molex “PicoBlade” connector (Molex part number 15134-1001), but it was fairly easy to solder to the board. I used a SAMD21 microcontroller (the SparkFun SAMD21 mini breakout board is a great choice) because it is more powerful than a simple Arduino Uno and it has more hardware serial interfaces. I need one serial interface for a GPS module and one for the satellite modem. You might want one for serial communication to some other device, too! It’s good to have lots of hardware serial interfaces. I have grown tired of using software serial, as it can introduce problems and I don’t have time for that.
The board also has an Adafruit GPS breakout board for plug-n-play GPS. I just put female headers on the board so I can redeploy the SAMD21 and GPS boards in other solutions someday. I also added an SSD1306 OLED display for output and a few LEDs with 220 ohm resistors, along with some buttons and a 10K pot for input. These are just generic parts. The Eagle design files are in the project GitHub repository.
Rock Seven Account
To use the modem, it has to be registered with Rock Seven Communications. You have to pay a monthly line rental fee to keep it active on the network, and you have to buy credits that are used up as you send messages. Rock Seven is a British company, so all the prices are in GBP. Line rental costs £12 per month (click for conversion to U.S. dollars), and 100 credits costs £13. It costs one credit for every 50 bytes in a message. A message sent from a modem can be up to 340 bytes, and that would cost you 7 credits. As a system designer, I was highly motivated to keep my messages under 50 bytes!
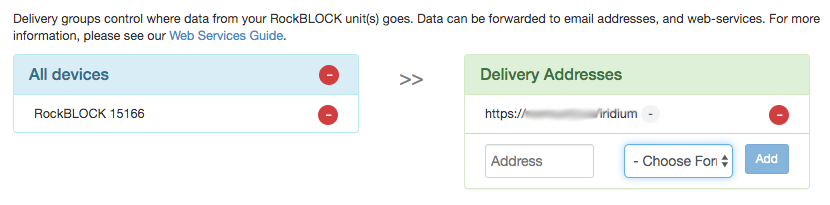
You also use your Rock Seven account to tell Rock Seven what to do with the messages when they get them from the Iridium constellation. This is called a “delivery group”. I’m having Rock Seven do an HTTP POST to my Node-RED server. Note that there doesn’t seem to be any security; I can’t specify a username and password for my server, so “security by obscurity” is the simple approach. That’s why I’m not showing you my AWS server name in this image. All the info you need about the integration between Rock Seven and your application can be found here.
Communication Experiments
For my experimentation I use an external antenna but the default configuration is to use a built-in patch antenna which works fine. You will need a clear view of the sky — satellite communication typically won’t work indoors (although I have successfully sent messages from indoors very near a window). For power, I’m using a portable 5V supply.
My Arduino program just lets you input a number from 1-100 using a potentiometer to show how data can be transmitted. I’m also transmitting the GPS coordinates and the time of the sensor reading. Keep in mind that sending a message can take several minutes. The IridiumSBD library can call a callback function you specify so you can do things during the long transmission time, like control an LED and print output. Once you tell the library to send a message, it will keep trying to contact an Iridium satellite, as it may take a while for one of the 66 satellites to fly over your area. The default timeout in the library is 5 minutes. If my program fails to send the message in 5 minutes, the red LED comes on. If successful, the green LED is lit.
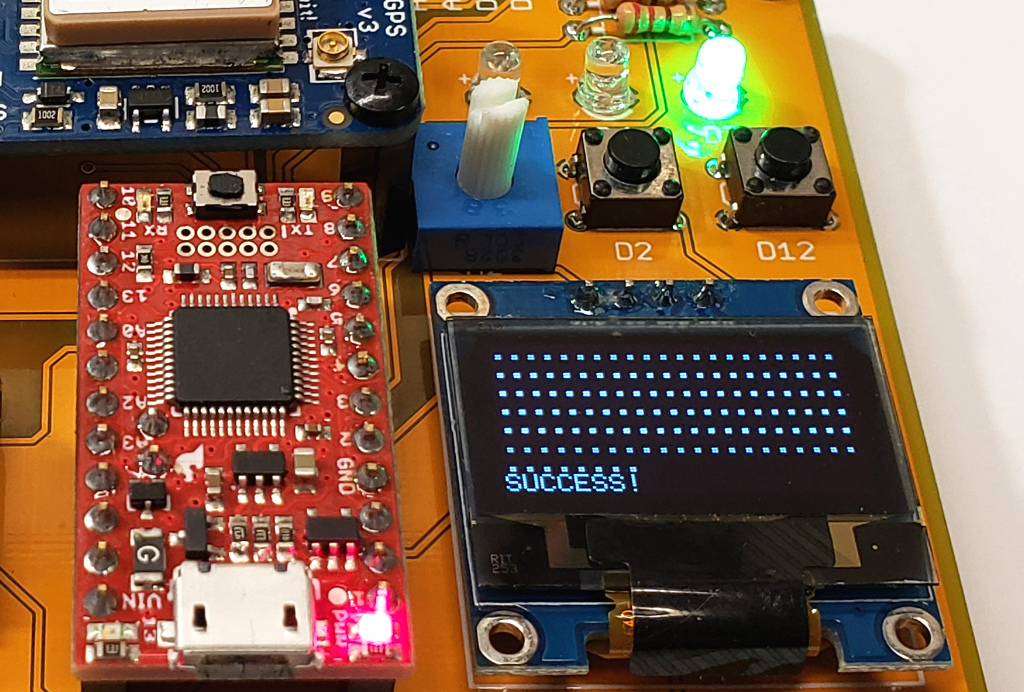
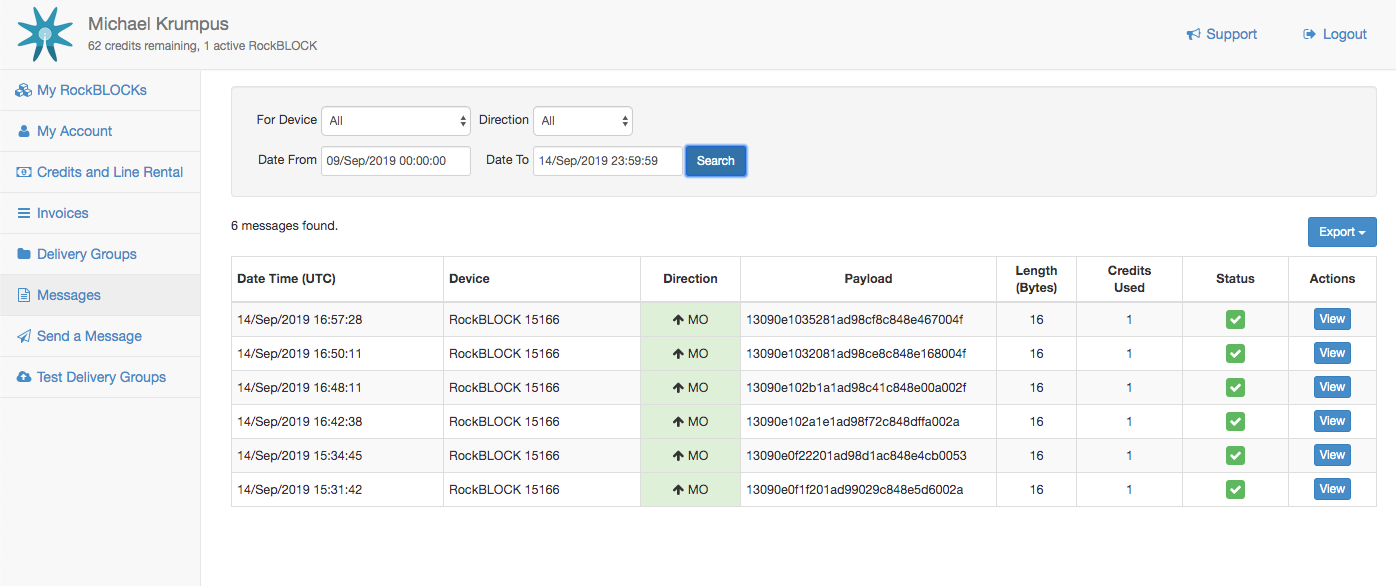
The payload of my message to the satellite is 16 bytes: 6 bytes for the timestamp (year, month, day, hour, minute, second), 4 bytes each for latitude and longitude, and two bytes for the data value. The Rock Seven management console lets you see the messages received by Rock Seven and forwarded to your destination server. The payload is sent as hexadecimal, so my 16 byte message is actually sent as 32 HEX characters to my server.
Processing Messages
After receiving the data over the Internet from Rock Seven, you can do whatever you want with it. I am processing the messages with a Node-RED server and displaying the received value on a web dashboard.
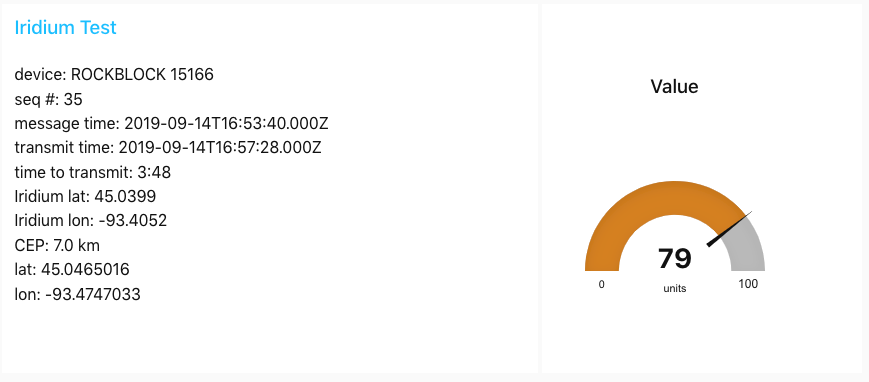
Along with the payload, Rock Seven delivers metadata, including the time at which the satellite received the message. I compare this to the time that the microncrontroller started sending the message so we know how long the process really took. In this case, it took 3 minutes and 48 seconds to successfully transmit to a satellite. The data also provides an approximate GPS location where it thinks your modem is. This is the CEP parameter in the metadata. This can be off by several kilometers, so if you are interested in actual location, you will need to use a real GPS module, like I am.
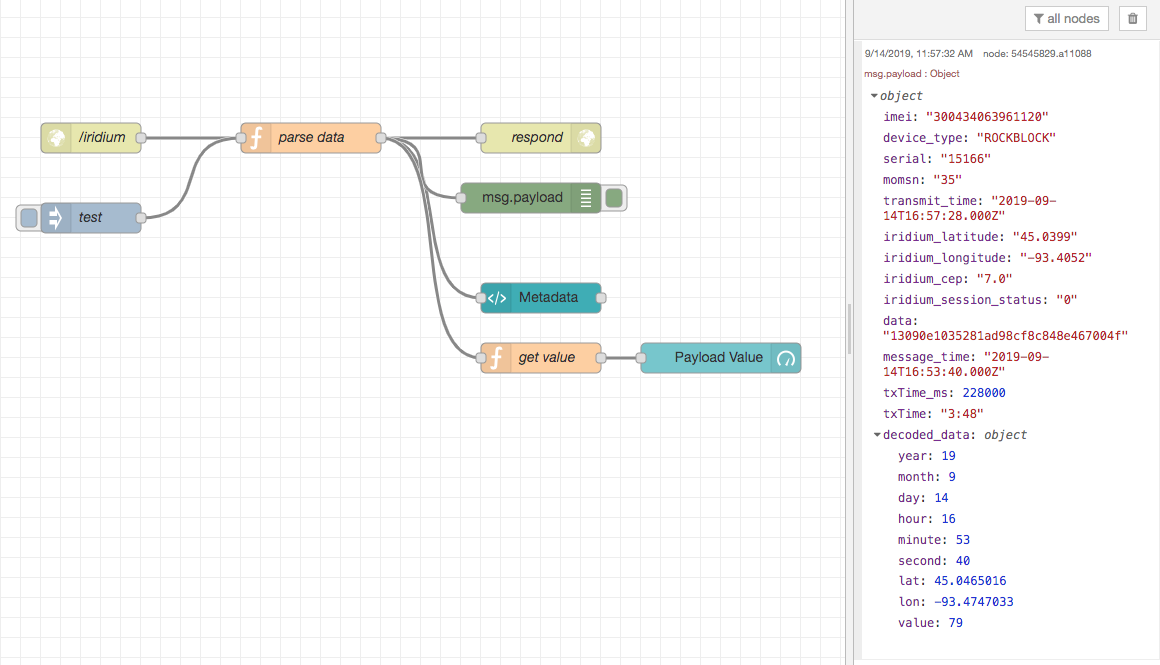
Here is the JavaScript code in the function node “parse data”. The decoded data is passed along to the dashboard display widgets.
var data = msg.payload.data;

var p = 0;
var year = parseInt(data.substr(p,2), 16);
p += 2;
var month = parseInt(data.substr(p,2), 16);
p += 2;
var day = parseInt(data.substr(p,2), 16);
p += 2;
var hour = parseInt(data.substr(p,2), 16);
p += 2;
var minute = parseInt(data.substr(p,2), 16);
p += 2;
var second = parseInt(data.substr(p,2), 16);
p += 2;

var latString = data.substr(p,8);
var lat = parseInt(latString, 16);
// can be negative, so check for sign bit
if (lat & 0x80000000) {
    lat = lat - 0x100000000;
}
lat = lat / 10000000.0;
p += 8;

var lonString = data.substr(p,8);
var lon = parseInt(lonString, 16);
// can be negative, so check for sign bit
if (lon & 0x80000000) {
    lon = lon - 0x100000000;
}
lon = lon / 10000000.0;
p += 8;


var valueString = data.substr(p,4);
var value = parseInt(valueString, 16);


// time that the message was created and ready to send
var msgTime = new Date(year+2000, month-1, day, hour, minute, second);
msg.payload.message_time = msgTime;

// time that the message was actually successfully transmitted to satellite
var txTime =  new Date("20" + msg.payload.transmit_time);
msg.payload.transmit_time = txTime;

var txMilliseconds = txTime.getTime() - msgTime.getTime();

var txMinutes = Math.floor(txMilliseconds / 60000);
var txSeconds = (txMilliseconds % 60000) / 1000;
var txTimeString = txMinutes + ":" + txSeconds;
msg.payload.txTime_ms = txMilliseconds;
msg.payload.txTime = txTimeString;

msg.payload.decoded_data = {
   year: year,
   month: month,
   day: day,
   hour: hour,
   minute: minute,
   second: second,
   lat: lat,
   lon: lon,
   value: value
}
return msg;
Resources
GitHub repo with the code used in this project and the board design files
RockBLOCK 9603 modem documentation
GitHub repo for IridiumSBD library
Detailed documentation for IridiumSBD library
Going Further
There are some things I haven’t tried yet. A satellite modem can actually receive messages from your server via Rock Seven. I also think it is important to design a security solution. A shared secret between the modem and Internet application may be sufficient, but deploying secrets to IoT devices has its own complexity. I could send a security token to the modem securely because sending a message to a modem requires Rock Seven credentials. The modem could then present the security token in each message, and the endpoint processor could require it. I think this would be reasonably secure, but the security token would take up valuable bytes in each message.
Summary
Using a Rock Seven Iridium modem is a lot of fun and it can be an important part of an IoT solution when you don’t have other connectivity options. It’s not cheap, you need a clear view of the sky, and it can take several minutes to send a short message. But if you can design a solution within those constraints like I have, it’s completely viable. And special thanks to Mikal Hart for writing the awesome Iridium SBD library!
