Project source code at GitHub: lora-mesh
In this project, I will show you how I built a mesh network of 4 Arduino-Based LoRa modules and devised a way to visualize the network’s behavior in realtime. Using a realtime visualization we can see how the network forms and how it heals itself when network nodes become unreachable.
By now you’ve probably heard of LoRa (“long range”) radio technology. It is intended for reliable communication of small amounts of data over long distances (several kilometers). It’s also geared toward low power applications. LoRa modules are relatively cheap (about $8 for a bare module), but the easiest way to use LoRa is to buy development boards that also have a microcontroller on them, like the Moteino.
LoRa radios can be used for point-to-point communication, and can also be used in a LoRaWAN network which involves communication with a centralized base station. This article, however, discusses a different approach: mesh networking of LoRa nodes. Mesh networking is a network topology where nodes communicate with one another either directly (if they are in range) or indirectly via intermediate nodes. For example, if node 1 wants to send a message to node 2, but is too far away from node 2, the message will automatically be routed via an intermediate node that is in range, say Node 3.
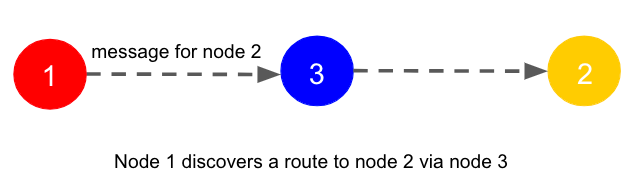
In fact, the path may involve several intermediate nodes. The discovery of the route from 1 to 2 is handled by a mesh networking layer — your application code doesn’t need to know anything about the routing. With mesh networking, LoRa nodes can be spread out across a further distance but can still communicate with one another as long as there is some connectivity between nodes in the mesh. Every node can talk to every other node, even though the network is only partially connected. Sound familiar? This is pretty much the architecture of the Internet. The robustness lies with the ability to route around damage and find new routes.
Mesh Networking in Arduino Code
How do we accomplish mesh networking with simple LoRa radios? If you have used LoRa radios before, you probably used the RadioHead library. We will use it in this project, too, because it includes an implementation of mesh networking. For details on how the mesh works, see the RadioHead documentation about it. I wrote an Arduino sketch to run on each of 4 Moteino boards so that each node will form a part of the network. Each node has an identity (e.g. “2”) which is stored in the device EEPROM.
First a note about the difficulty of testing mesh networks. It’s hard to place the nodes in such a way that only some nodes can communicate directly. To do so, I’d have to put my nodes far apart all over my neighborhood. Lucky, the RadioHead library has several test networks defined so that you can force some nodes to not be able to communicate. When a test network is defined, the RadioHead library simply ignores messages is receives from nodes it is not supposed to be able to hear. This lets us test much more easily. I’m using test network #3 which is defined in the library like this:
#elif RH_TEST_NETWORK==3
  // This network looks like 1-2-4
  //                         |   |
  //                         --3--
That is, nodes 1 and 4 cannot communicate with one another directly, and nodes 2 and 3 cannot communicate with one another directly. This will become very evident in the visualization.
Each node attempts to communicate with every other node in the network, and in the process it keeps track of a routing table that describes which nodes it can talk to directly and which nodes that messages get routed through when there is no direct connection available. It also keeps track of the signal strength that it “hears” from a node when it communicates with it directly. The result is that each node has a data structure with this info. Here is a sample routing table (expressed in JSON) for node 2:
{"2": [{"n":1,"r":-68}, {"n":255,"r":0}, {"n":1,"r":0}, {"n":0,"r":0}]}
The data has an array of 4 records, one for each node in the network. The 4 records above represent the routing info for this node (2) communicating with nodes 1, 2, 3, and 4 respectively. Each record has two properties. Propery “n” is the identity of the node that node 2 must talk to in order to communicate with the node in this position of the table. Record number 1 {"n":1,"r":-68} means that node 2 can talk to node 1 via node 1. That is, it has successfully communicated directly with node 1 and the signal strength indicated by the “r” property is -68 dBm.
Record 2 {"n":255,"r":0} has an “n” value of 255 which means “self”, so we can ignore this record. Record 3 {"n":1,"r":0} means that node 2 must communicate with node 3 via node 1 because there is no direct communication (which is why the RSSI value is 0). Record 4 {"n":0,"r":0} has a “n” property of 0 which means that node 2 has not yet discovered a way to talk to node 4. This may because it has not tried yet, or perhaps node 4 has dropped out of the network and nobody can find it.
Over time, by attempting to send messages to every other node, each node builds up this information about who it can talk to and how its messages are being routed, as well as the signal strength that it “hears” from any node it successfully communicates directly with. The information sent in messages is the node’s routing table itself. That is why we represent the routing table as a JSON string and use abbreviated property names. We want the message to be short.
Visualizing the Mesh Network
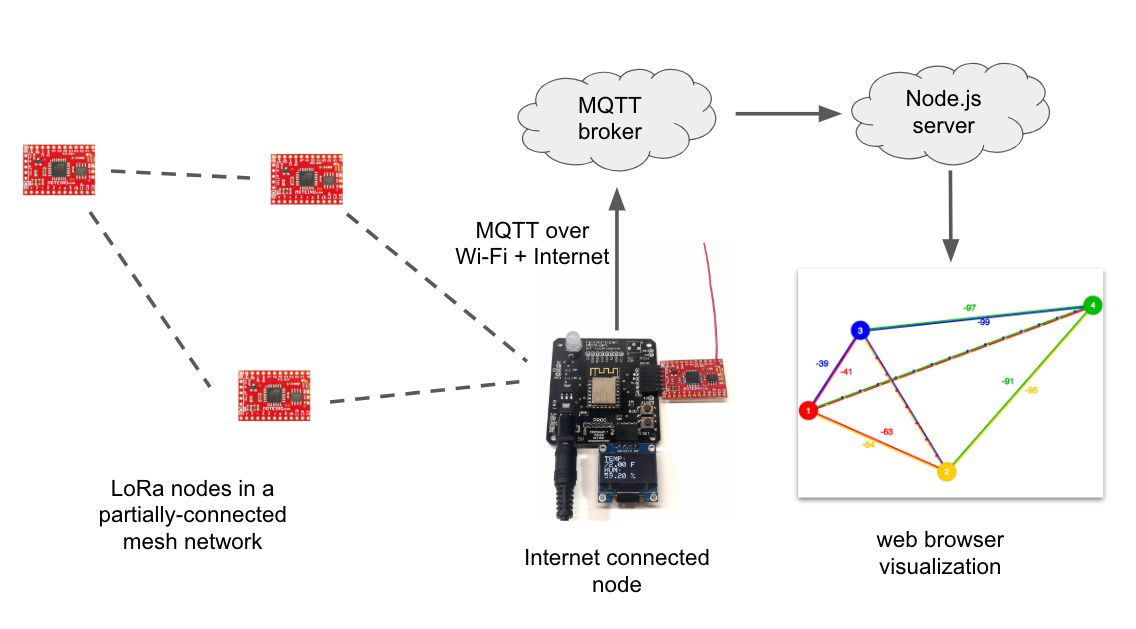
In order to display the network in a web page, we need to get all the routing information from each node. One of the LoRa nodes in my network (node 1) is connected to the Internet by connecting the Moteino board to an IoT Experimenter board. The IoT Experimenter is a simple ESP8266 development board I built to help with my IoT projects. It serves as a gateway to the Internet for this project. When node 1 receives a routing table from another node, it writes the JSON data over serial to the ESP8266 gateway code. The gateway writes the record to an MQTT topic. Over time, the routing table from each node is written to the topic and updated as the info changes.
Now we need a way for this information to be displayed on a web page. I wrote a Node.js server that subscribes to the MQTT topic and writes the info over a websocket to a web client using Socket.IO. The graphics are created using p5.js which is an easy way to draw impressive graphics on a web page canvas.
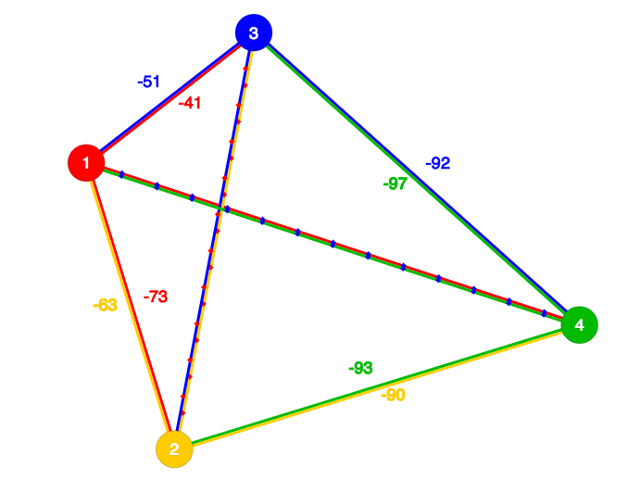
A solid line between 2 nodes means there is direct communication. The color of the line matches the node that is making the observation, and the number is the signal strength that the node “hears” from the other node. So below we can see that node 1 and 2 are directly able to communicate and that node 1 is receiving from node 2 with an RSSI value of -63 dBm and node 2 receives from node 1 with an RSSI of -64 dBm. The distance between nodes is proportional to the signal strength — you can see that node 4 is further away from the other nodes.
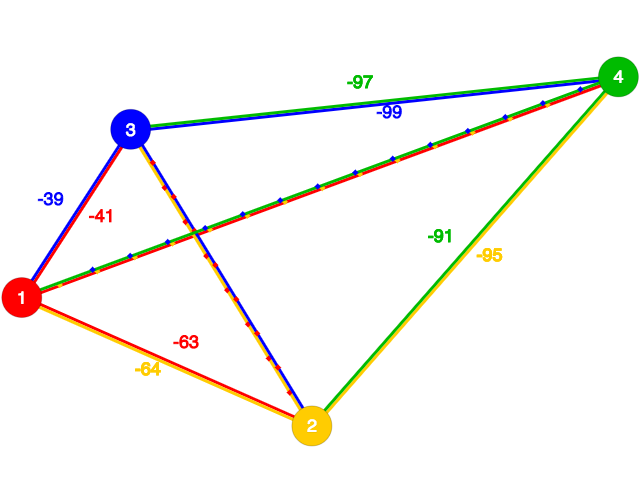
Lines with dots indicate indirect communication, for example, the lines between nodes 1 and 4 mean that they are communicating indirectly. The yellow dots on the red line mean that node 1 is communicating with node 4 via node 2 (which is yellow). The blue dots on the green line mean that node 4 is communicating with node 1 via node 3. Note that the communication between nodes 2 and 3 have red dots, meaning that node 1 is serving as the intermediary for these nodes.
Formation/Healing of a Mesh Network
Let’s see the visualization in action! This video shows the formation of a network when I connect power to the nodes. In the video I remove power from one of the nodes serving as an intermediary in the mesh and we can see how the network heals itself by finding new routes.
Get the Code
All the source code for this project is available on GitHub: nootropic design lora-mesh project.
It includes info on how to use this code yourself if you are interested.

What would cause the invalid length error?
I modified the code to use the RFM69 radio rather than lora.
I have it compiling and running on an ESP32 and initializing the radio ok. For some reason I get invalid length on every loop
Is it possible make comunnication only with 2 nodes, with id 1 and 2 ?
initializing node done
ABZ ready
->1 :[{“n”:190,”r”:0},{“n”:255,”r”:0},{“n”:190,”r”:0},{“n”:190,”r”:0}]
initializing node done
ABZ ready
->2 :[{“n”:255,”r”:0},{“n”:190,”r”:0},{“n”:190,”r”:0},{“n”:190,”r”:0}]
I am using the STML032 and SX1276
Thank you so much!
Hi
I am getting the following error when compiling for TTGO ESP32 Lora V2.
sketch\LoRaMesh.ino.cpp.o:(.literal._Z7freeMemv+0x0): undefined reference to `__brkval’
sketch\LoRaMesh.ino.cpp.o:(.literal._Z7freeMemv+0x4): undefined reference to `__heap_start’
Just remove the int freeMem() routine and the reference to it from the setup.
these registers only appear on the AVR, not the SAMD M0 or ESP
hi Pieter,
I am desperately trying to get this working with ttgo lora32.
would you be able to assist perhaps please. i have a project/prototype i am working on and i am struggling. :(
how to connect rfm95 with arduino uno & mini, I want pin connection
Thanks to Michael for putting this up here.
I’ve had it working fine this morning, and then it stopped working for me. I can load other LoRa scripts and they seem to work fine, but I always get the RHRouting table return empty now. bit of a pain. I’m using an ESP32 and RFM95.
In case anyone’s come across this – please let me know. I figure it’s a radiohead issue or something in the ESP32 that isn’t right
Hi, I am doing some work for the faculty and I am trying to implement this project with arduino uno, esp8266 esp-01 and lora shield for arduino. The problem I am having is that the esp8266wifi library does not load on the arduino uno, should I load the gateway code to the esp8266 and the node code to the arduino with lora ???
On that IoT Experimenter ESP8266 board do you have any microcontroller chip where they load the gateway or do they do it in the firmware of esp8266?
Thank you
How would I wire an Arduino Pro Mini (3v) to a RA-02. I am currently using NSS, MOSI, MISO and CLK of the RA-02 to pins 10, 11, 12 and 13 of the Pro Mini respectively. The system gets to initializing node and stops there.
Thanks in advance
Never mind, I purchased a Moteino board and got it working fine.
Then I used an Arduino pro mini 3.3v for the other units.
The wiring goes as followed.
Lora. Arduino pro mini
NSS. 10
CLK. 13
MOSI. 11
MISO 12
D0. 2
please attach this at Setup in code:
digitalWrite(LED,HIGH);
delay(10);
digitalWrite(LED,LOW);
delay(10);
digitalWrite(LED,HIGH);
Then its Work Fine…..
also connect Lora reset at pro mini pin 9
excellent project unfortunately I have an error in which appears no route someone knows how I could solve it.
-> 3 [{“n”: 63, “r”: 16380}, {“n”: 8, “r”: 236}, {“n”: 9, “r”: 16380}]
! no route.
thank you very much for this incredible project
how could you got this data ?
3 [{“n”: 63, “r”: 16380}, {“n”: 8, “r”: 236}, {“n”: 9, “r”: 16380}]
3 [{“n”: 63, “r”: 16380}, {“n”: 8, “r”: 236}, {“n”: 9, “r”: 16380}]
this is wrong data ,
r is the signal strength .. so you put like -97, -105 etc
superb tutorial for mesh networking …
when i’m uploading code of LoraMesh with attaching RESET pin of lora to arduino pin 9 then its hang, then i saw There is no need of attaching reset pin to arduino just connect following pins only.
Lora. Arduino pro mini
NSS. 10
CLK. 13
MOSI. 11
MISO 12
D0. 2
Hello everyone, I am 73 years old retired Telecom Engineer and my hobby is IoT.
When I am upload the Gateway code and getting this error in Serial Monitor.
I tried both Wemos mini and also in ESP8266.
I request someone to reply here, the library version and ESP board firmware version you used in your working Gateway. Please reply, thank you in advance
Error Message:
ets Jan 8 2013,rst cause:2, boot mode:(3,6)
load 0x4010f000, len 3584, room 16
tail 0
chksum 0xb0
csum 0xb0
v2843a5ac
~ld
Hello everyone, I am 73 years old retired Telecom Engineer and my hobby is IoT.
When I upload the Gateway code, I am getting this error in Serial Monitor.
I tried both Wemos mini and also in ESP8266.
I request someone to reply here, any pointers, the library versions and ESP board firmware version you used in your working Gateway.
Please reply and thank you for your guidance.
Error Message:
ets Jan 8 2013,rst cause:2, boot mode:(3,6)
load 0x4010f000, len 3584, room 16
tail 0
chksum 0xb0
csum 0xb0
v2843a5ac
~ld
Ragothaman,
Since I did the project 3 years ago, I don’t know what version of the ESP8266 Arduino core I was using at that time. But you should be able to use a current version of the ESP8266 board support in Arduino for the gateway code. I would try connecting to your MQTT broker without TLS to see if removing that complexity helps.
Change this line:
WiFiClientSecure espClient;to
WiFiClient espClient;Hi Michael
We have a project we want to use LoRa Mesh with up to say 500 nodes with a building.
Very little traffic with only one message at a time.
Is LoRa Mesh practical?
Can we consult you for a hardware and FW solution?
I make a device mesh network for my project I used esp32+ Lora in and each can use that device as gateways to get that image is it possible?
I used esp32 + Lora sx1278 I don’t know the circuit diagram of this code can you give it?
Is there any map of users? I am wondering if it makes any sense of deploying it in my region of Europe.
in my experience, users want to see where the nodes are on a map, but users do not want anyone to see their location. I have spoken with so many people and they are radically against sharing their own location on a map for complete strangers to see. I think you could instead show a circle and show the number of user in that area. that might work.
Hi, i’m trying to setup a network with 4 atmega328p with 4 relatives RF95 modules. I set one different id for each module but if i ran the main code it crashed during the first string concat
I am using Ai-Thinker Sx1278 RF Wireless Transceiver Based on LoRa Module RA-02 Breakout Board and ESP8266. I had uploaded setNodeid code to esp8266 and given nodeid=2, but it fails also mesh network not created. Please help, Thanks in advance
EVERYONE: this project is not for ESP8622 or ESP32 microcontrollers. This project was built with ATmega328 microcontrollers. You should have NO EXPECTATION at all that the LoRa mesh code will work on ESP devices.
Why this code wont work on ESP? Is there any way to make it work on ESP?
This is NOT an ESP project! I don’t know why everyone is coming here for help thinking that this will work on ESP devices. I wish everyone would stop asking for ESP help when the project clearly states it is for ATmega328 devices.
Will LoRa work with apple and android devices if there is an app on the phone that can be used if the device is charged and the app is already on the device?
No, phones do not have LoRa radios.
thank you for the info
it look like when we search esp8266 rfm95 this post is on top.
mabee do a goofle search to fix the esp comment you having here, i was also trying to make this work until i keep reading and read more and more and more until this comment
I am going to give this a try. I think the confusion may be that the ESP board was used as the MQTT broker but only gathering serial data form board #1. This looks like exactly what I need for my application. Thanks
Hello to all,
i have the same problem like Ragothaman R.
i get the fault message :
ets Jan 8 2013,rst cause:1, boot mode:(3,6)
load 0x4010f000, len 3584, room 16
tail 0
chksum 0xb0
csum 0xb0
v2843a5ac
~ld
Anybody know an answer?
Many Thanks !!!
Is there someone that could help me set one of these networks up or give me guidance to do it myself?
https://nootropicdesign.com/projectlab/2018/10/27/lorawan-gateway/
dear all,
void updateRoutingTable() {
for (uint8_t n = 1; n getRouteTo(n);
if (route == NULL) {
if(n==nodeId)
{
routes[n-1] = 255;
}
continue;
}
use this is your table code then it will work on esp32
I’m trying this but it’s not working. Could you make it work?
How can you expect help when you just say “it’s not working”? Please do not try this project unless you are expereienced in Arduino. Too many people have problems.
Thank you for your patience. I have been in IT for over 35 years. Great software.
I am new to this LORA mesh networking. I am currently working on an IOT based flood monitoring and irrigation control project. My question is can I connect sensors and actuators to these LORA nodes thereby send and receive data. Can I have more than one internet connected node such that I can deploy the system over a very large scale. Thanks for the answer in advance.
same problem
Hi Michael! Great project. I am using Arduino Mega and UNO as nodes. Whenever I run the code it gives me “init failed” error. I am a beginner so any help in this regard will be helpful.
Regards
Hi Muneeb,
Connect lora NSS to arduino D10
MISO -> 50
MOSI -> 51
SCK -> 52
SS -> 10
DIO0 -> 2
RST -> NC
Hello,
I would like to know how many nodes maximum I can put on the network, thanks.
Ivan Spera.
Hi @all!
reading the code it seems that 253 is the max no of nodes in the field, right?
Hi how are you?
I found your project very interesting.
I’m trying to add the
libraries
RHRouter.h
RHMesh.h
RH_RF95.h
but I can’t, could you help me?
Elias.
Did you read the article? It tells you which library to use and provides a link to it!
Hi,
I read your article, it is very interesting.
I am trying to create LoRa mesh network for smart meter. Can all LoRa module work in a mesh network? Or do I have to use only the LoRa mesh compatible module?
The mesh networking is a software implementation, not a hardware feature.
okay. Thank you.
hi michel
how to send many informations in the node to gateway ?
Michael,
Thank you for your hard work on this project.
I’m an old man and I’ve been in IT for many many years. And I appreciate your perseverance, answering questions years after rolling this project out.
Hi, I wanted to try this out with ESP but the code provided in the GitHub link wasn’t compiling. As per someone’s suggestion, I commented out the freeHeap function, but now the ESP module is kernel panicking and crashing. Let me know if you require more info
Hello,
I read into the LoRaMesh .ino code:
#define N_NODES 4
…then if I need to add an additionnal node, I have to reflash all the existing nodes?
Does it work if I use:
#define N_NODES 32
and nodes are 7 by example?
It is then possible to add dynamically another node.
Many thanks,
Phil
Just wanted to offer what I did to get this software to initialize on an ArduinoUno/DraginoShield pair. Pretty simple really. Change the defined value of LED from 9 to 8, or something else that is appropriate. Per https://wiki1.dragino.com/index.php?title=Lora_Shield#Example2_–_Use_the_RadioHead_Library_With_Arduino_Boards, “The RF95-server sketch use the led=9 to show the status. please change it to other LED , such 8. because 9 is connected to the LoRa module’s RESET pin. you will see ‘init fail’ in the default server sketch.”
Hello,
About LoRaMesh, I succesfully flash the eeprom with number 1 to 4 (4 modules)
Then I flash LoRaMesh.ino into my 4 modules.
Unfortunately, for each module I receive an error message:
initializing node init failed
RF95 ready
mem = 806
->1 :[{“n”:0,”r”:0},{“n”:0,”r”:0},{“n”:0,”r”:0},{“n”:255,”r”:0}]
Thanks for your assistance ;-)
Phil
Hii LUYTEN
Have you got any solution of this problem ?
initializing node done
RF95 ready
mem = 6417
->1 :[{“n”:0,”r”:0},{“n”:255,”r”:0},{“n”:0,”r”:0},{“n”:0,”r”:0}]
! no route
Am getting only no route.what else i need to change?
Hello, first of all thanks for your contribution. I am currently trying to port this project to TTGO LoRa, as you know, it is an esp32 that has LoRa SX1276 integrated, what should I configure to port it to this board?, should I modify the RH_RF95 library?, or what do you suggest I should do.
Thank you.
HI, just want to say this is a brilliant project!
I’m trying to reproduce this on MKR1300, but it seems won’t work properly.
I always get serial message like:
initializing node init failed
RF95 ready
->2 :[{“n”:255,”r”:0},{“n”:127,”r”:0},{“n”:127,”r”:0},{“n”:127,”r”:0}]
any suggestion will be appreciated,
thank you~
Have you got any solution ?