Project source code at GitHub: iridium-signal-strength-monitor
In a previous article, I wrote all about Iridium satellite communication for IoT projects using an Iridium modem and simple Arduino technology. However, when trying to send a message to a satellite constellation, you never know if the message will go right away or if it will take several minutes. Sometimes there is a satellite overhead, but sometimes you will have to wait a while before one flies over you. I decided to investigate how the signal strength reported by the Iridium modem (AT+CSQ command) correlates to the actual positions of Iridium satellites. So I used the amazing CesiumJS open source JavaScript library and the hardware I built in the previous project to make a great tool that shows how signal strength matches up with the satellite positions! Understanding the reception quality of satellite constellations is going to become increasingly important as companies like SpaceX roll out their low earth orbit (LEO) Internet connectivity solutions like Starlink.

How It All Works
There’s a lot going on here, so let me explain. First, I deployed my simple development board that I built before but this time I connected an ESP8266 to the serial line so that it could send information to the Internet. The Arduino code on the dev board uses the Iridium SBD library to ask the modem for the “signal strength” that it has at the moment. This gives a value from 0-5. It writes this info over serial to the ESP8266 which publishes it to an MQTT topic. So basically this sits outside with the antenna pointed to the sky and asks the modem every 5 seconds what the signal strength is. The GPS module allows me to attach an accurate timestamp to the reading so that the data can be matched up with the satellite position info.
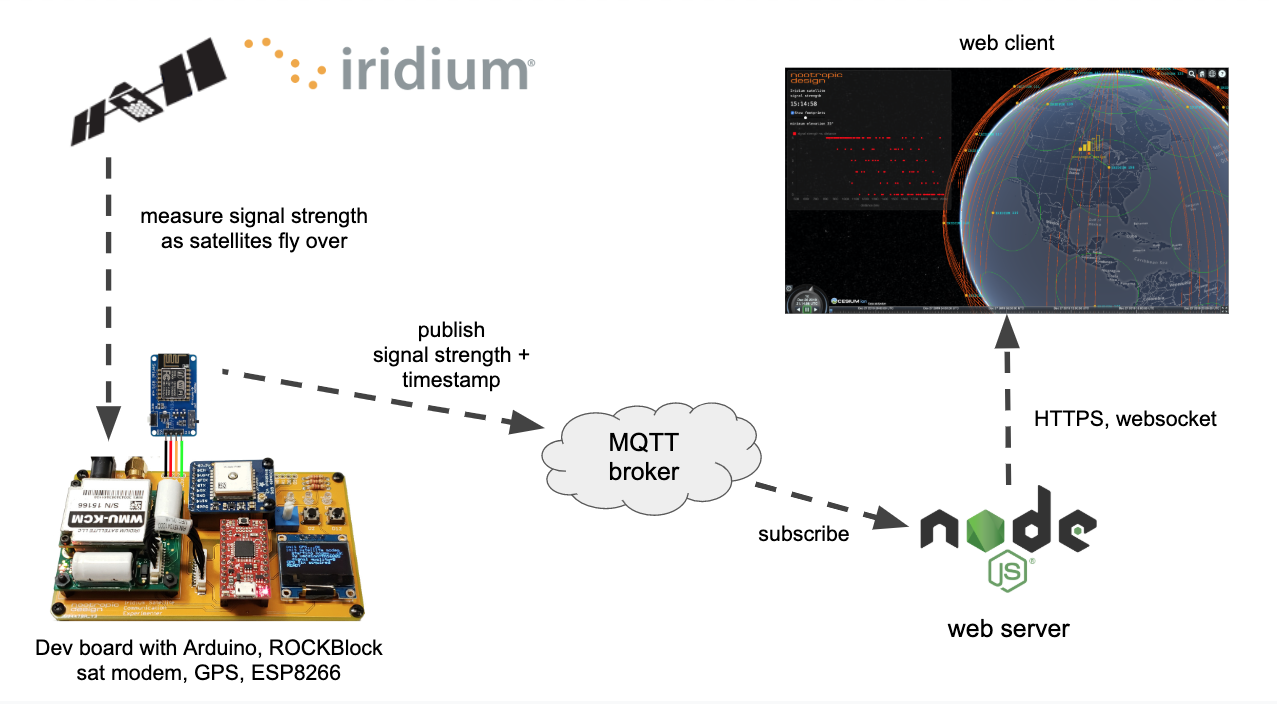
On the software side, I wrote a web tool using CesiumJS that displays the orbits of all the Iridium satellites. It calculates the orbits from the Iridium two-line element sets (TLEs) from Celestrak. CesiumJS is a great way to visualize orbits and show the positions of satellites in realtime. You can zoom in, pan and tilt the globe, OMG it’s just gorgeous. The web client is served up from a simple NodeJS server that also subscribes to the MQTT topic to get the signal strength data as the hardware publishes it. The server sends the data up a websocket to the web client.
In addition to showing the realtime satellite positions and predicted orbits, the web tool also:
- displays the current signal strength as 5 bars, just like your phone
- calculates the closest satellite to the ground station and renders a green line to it
- displays the footprint of each satellite. You can change the elevation angle using a slider. When set to zero, the footprint represents visibility to the horizon. I have found that setting this to 25 degrees gives a more accurate depiction of the satellite’s communication range. That is, my hardware can “hear” the satellite if it is at least 25 degrees above the horizon.
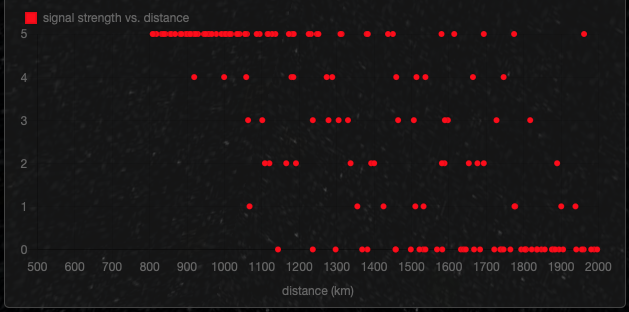
- plots the signal strength vs. the distance to the closest satellite on a scatter plot. This should show that higher signal readings are correlated with shorter distances to the closest satellite.
Results
Well, does it work? Does the signal strength reported by the modem correspond to the actual proximity of an Iridium satellite? Yes, it does! It’s not perfect, but this is RF, so one should not expect perfectly predictable measurements. There are all kinds of factors at play in RF propagation. But generally speaking, I measure zero bars when there are no satellites overhead, and measure a stronger and stronger signal as a satellite approaches. The scatter plot that is built up over time definitely shows that strong signals (vertical axis) are associated with smaller distance to the closest satellite (horizontal axis).
This video shows the experiment in action. The great thing about building a CesiumJS model is the ability to have all the data stored in a time series that you can play back at different speeds and even play it backward. Since satellites move slowly, it’s very helpful to back up in time and play the sequence forward at higher speeds. And it looks beautiful, too!
Software
You can try this yourself if you have an Iridium modem like the RockBLOCK 9603 modem. Or you can use the CesiumJS orbit visualization for your own projects. GitHub repo: iridium-signal-strength-monitor
Even if you don’t have the hardware to measure signal strength, you can use the the CesiumJS web application to show the realtime positions of Iridium satellites.
Here are some things you will need to change in the software if you want to do this project:
In the code for the ESP8266 MQTTWiFiGateway.ino:
const char* mqtt_server = "your_mqtt_server";
const char* mqtt_username = "mqtt_user";
const char* mqtt_password = "mqtt_password";
For the webserver and CesiumJS web application, set your MQTT server and credentials in server.js:
var options = {
    host: 'your_mqtt_server',
    port: 1883,
    username: 'mqtt_user',
    password: 'mqtt_password'
}
You will need to get a Cesium Ion access token. It’s free.
Set your Cesium Ion access token in app.js:
Cesium.Ion.defaultAccessToken = 'YOUR_CESIUM_ION_ACCESS_TOKEN';
To use the MapBox dark imagery like I did, you’ll need to get a MapBox access token. Also set in app.js:
imageryProvider : new Cesium.MapboxImageryProvider({
    mapId: 'mapbox.dark',
    accessToken: 'YOUR_MAPBOX_ACCESS_TOKEN'
})
Installation and startup:
cd webserver
npm install
npm start

Brilliant idea.
How do you change the location of the Ground Station ?
My Location is Lat. 57.18360 Lon. -002.13055
I have managed to get it running without the hardware to see the real-time positions of the iridium satellites.
The ground station location is set in the file app.js of the webserver.
https://github.com/nootropicdesign/iridium-signal-strength-monitor/blob/master/webserver/app.js
You can change it.
thank you very much
Very informative! Do you have any videos published that show this in real time (not sped up)? I need to visualize and understand how much time a fixed ground station will be out of range of an Iridium signal
I don’t. But “in range” is hard to characterize, because it depends upon the angle of elevation that you consider “in range”. This video shows the outline of a 25 degree elevation angle. I think that when designing a solution, you should expect that it may take 10 minutes to succesfully send or receive a message. You may have to wait that long for a satellite to be in view for successful communication, but it’s hard to quantify. I encourage you to download the GitHub repo for this project and run the node server yourself to view the satellite motion. Comment out the MQTT integration that is used to receive signal strength data.
Hi, cool project. Any experience with RUDICS?
No, I have not used RUDICS connectivity with Iridium.
HI, I have a unique application of the Iridium modem and was wondering if you have any insight. We use the Iridium modem to transmit GPS locations from wildlife collars attached to animals. One of the questions we always get is why the transmission download isn’t always successful. We try to explain it is because of satellite geometry, shadowing from topography or animal position relative to the antenna on the animal. Do you have any further detailed explanation or graphics to help illustrate this that you can share? thank you.